
The monthly financial report at a small business is mostly the same job every month. You export the numbers, compare them with last month and with the budget, work out what changed, and write a few paragraphs that tell the owner or the team what happened. AI assistants in Excel, Google Sheets and ChatGPT can now do much of the comparing, charting and first-draft writing. They cannot tell you why the numbers moved, and they can be wrong about the numbers themselves.
This guide shows a five-step workflow you can repeat each month, prompts you can copy, which tool fits which setup, and the checks that keep a person in charge of the final report.
A note before you start: this is a workflow guide, not financial or accounting advice. The numbers in your report are your responsibility. Anything that is filed, used for tax, or sent to lenders or investors should go to your accountant or bookkeeper for review. Treat AI output as a first draft.
What can AI do for a monthly financial report?
For a typical small business report (revenue, expenses, budget versus actual, cash), AI assistants are useful for four kinds of work:
- Comparisons. Month versus last month, month versus budget, this quarter versus last quarter.
- Finding what stands out. The largest changes, unusual transactions, outliers in a category.
- Charts and summary tables. A revenue trend, an expense breakdown, a budget variance table.
- Writing. A plain-English summary of what changed, and a shorter version for an email.
Microsoft describes Copilot in Excel as a tool for updating budgets, creating financial models and analyzing data, using normal Excel features such as tables, charts, PivotTables and formulas, so the results stay editable. Google lists similar jobs for Gemini in Google Sheets: tables, formulas, pivot tables, charts, and data analysis and insights. ChatGPT can analyze an uploaded spreadsheet, summarize trends and outliers, and build tables and charts.
What none of them know is the context: the client who paid late, the one-off repair, the price change you made mid-month. That part of the report still comes from you.
The five-step workflow for an AI-assisted monthly report
The same five steps work in any of the three tools. The point is to repeat them the same way each month, so the AI gets the same kind of input and you get output you can compare.
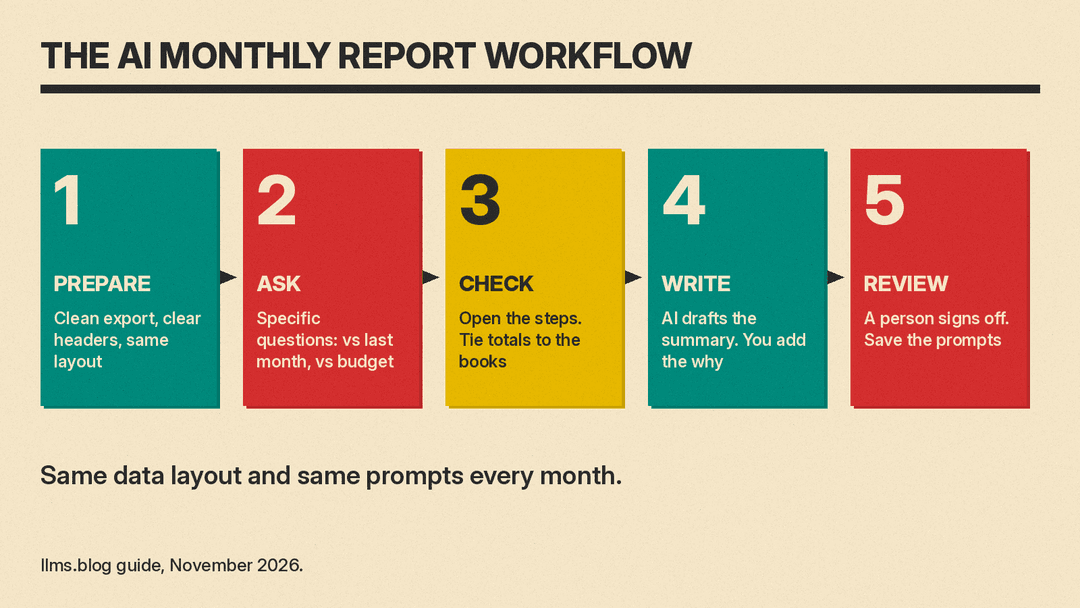
- Prepare the data. Export clean data with the same layout every month.
- Ask specific questions. Compare against last month and the budget, and ask what changed most.
- Check the numbers. Open the analysis steps, and tie the totals back to your books.
- Write the commentary. Let AI draft the summary, then add the reasons only you know.
- Review and send. A person signs off. Save your prompts for next month.
Step 1: How should you prepare spreadsheet data for AI?
AI tools read clean tables far better than formatted reports. All three vendors give similar advice.
OpenAI's data analysis guide recommends descriptive column headers in the first row, one row per record, and plain-language column names. It says to avoid putting several unrelated tables in one sheet and to avoid empty rows or columns that split the data. Google's January 2025 Gemini in Sheets announcement asks for a consistent format, clear headers and no missing values, and notes that complex analysis works most consistently in files below 1 million cells. Microsoft says Copilot's data analysis answers work with tables or table-like ranges, and that unstructured data is not supported.
In practice, for a monthly report:
- Export transactions or account totals from your accounting system as a plain table, not the printed report layout.
- Keep one sheet for actuals, one for the budget, and use the same column names in both (Month, Account, Category, Amount).
- Remove subtotal rows, merged cells and blank spacer rows.
- Use the same layout every month. Then your prompts keep working without edits.
Avoid scanned PDFs as the source. OpenAI says ChatGPT may not reliably extract exact values from scanned files or image-based tables, and recommends a spreadsheet or text-based file when exact values matter.
Step 2: What questions should you ask the AI?
Specific questions get better answers. Microsoft's own tip is to ask "Compare Q1 and Q2 sales" instead of "Tell me about sales." For a monthly report, name the month, the comparison, and the columns.
An open question can still help once you have the basics. Microsoft suggests "What's interesting about this data?" as a way to surface patterns you did not think to ask about. Treat the answer as a list of leads to check, not as findings.
Copy-paste prompts for a monthly financial report
Adjust the month, sheet and column names to match your file. Each prompt asks the AI to stay inside your data and show its work, which makes checking faster.
- Budget versus actual. "Using only the data in the Actuals and Budget sheets, build a table of each expense category for October showing budget, actual, the difference, and the difference as a percentage of budget. Sort by the largest difference. Show the formulas or calculations you used."
- Month over month. "Compare total revenue and total expenses for October with September using only this file. List the five categories with the largest change in either direction, with the amounts for both months. Show your calculations."
- Revenue breakdown. "Summarize October revenue by product (or by customer) from the Revenue column. Show each one's share of the total and how it changed from September. Use only the data in this sheet."
- Unusual transactions. "List transactions in October that look unusual compared with the previous three months, such as amounts much larger than usual for that vendor or category, or vendors that appear for the first time. Explain why each one was flagged. Do not guess at causes."
- Chart for the report. "Make a line chart of monthly revenue and monthly expenses for the last 12 months in this sheet, with month on the x-axis."
- Draft the summary. "Write a summary of October results for the business owner in under 200 words, in plain English, using only the figures in the tables above. Where a change needs an explanation, write [REASON NEEDED] instead of guessing."
- Email version. "Turn that summary into three short bullet points for an email to the team. Keep every number exactly as it appears in the summary."
The "[REASON NEEDED]" instruction in prompt 6 matters. AI tools can fill gaps with plausible but made-up explanations. Asking for a marker instead gives you a clear list of what you need to explain yourself.
Step 3: How do you check AI numbers in a financial report?
This is the step you cannot skip. All three tools give you a way to see how an answer was made, and OpenAI tells you to review that work before relying on it.
- In Excel, Copilot's data analysis answers use Python-based analysis, and Microsoft says you can expand the code to see how an answer was generated.
- In Google Sheets, Gemini offers an Analysis steps view for its answers and charts.
- In ChatGPT, OpenAI says to review the generated code, outputs and assumptions before relying on the result, and to ask for a specific method when the answer depends on one.
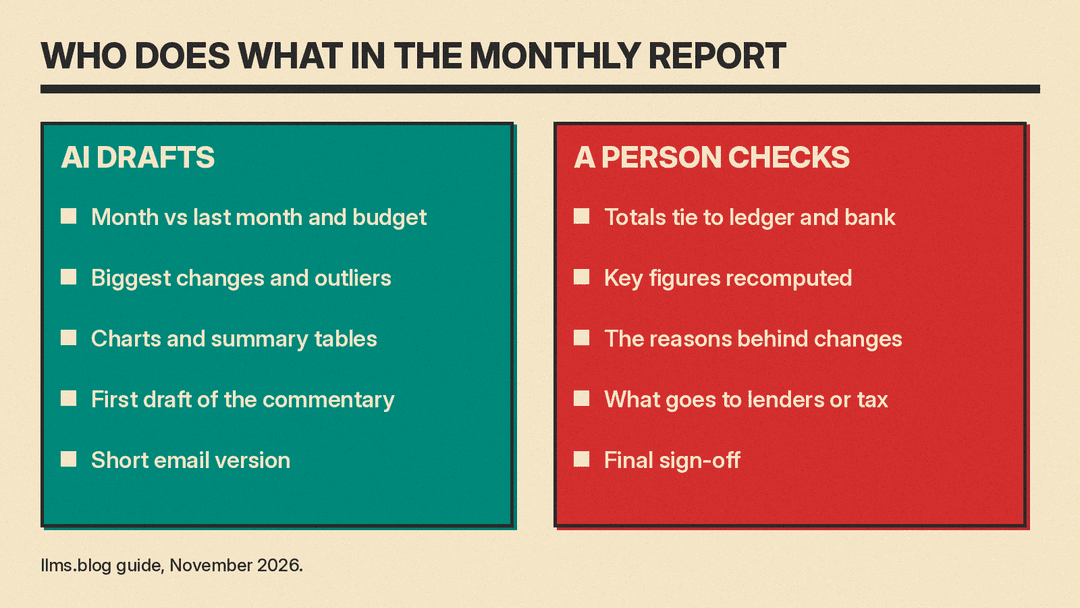
A short checklist that catches most problems:
- Tie the totals. Total revenue, total expenses and the cash figure should match your accounting system or bank statement. If they do not, stop and find out why before reading anything else.
- Recompute the key figures yourself. Use your own SUM or SUMIFS formulas for the three or four numbers that matter most, such as net income and the largest variance.
- Check what was included. Confirm the AI used the right month, the right sheet and every row. OpenAI notes that a file can upload successfully but still be too large or complex for complete analysis.
- Watch for charts that do not update. Google says a chart Gemini inserts is added on a new tab with its own copy of the data and does not respond to changes in the original data (charts from a BigQuery connected sheet are the exception). Microsoft says the tables and charts Copilot inserts from its data analysis answers are static and not refreshable. If you correct a number after making a chart, make the chart again.
- Read every sentence with a number in it. Each figure in the written summary should appear in a table you checked.
Step 4: How do you write the report commentary with AI?
Once the numbers are checked, let the AI draft the words. Give it the checked tables, not the raw export, and tell it who will read the report. Then do the part only you can do: replace each [REASON NEEDED] with the real cause. A large jump in a supplies category might be a bulk order, a price increase, or a mistake in coding. The AI cannot tell which.
Keep the commentary short. Most owners and teams want three things: how the month went against budget, the two or three changes that matter, and anything they need to act on.
Step 5: Review, send, and reuse next month
Have one person sign off on the final report, even in a two-person business. Then save the work for next month:
- Keep your prompts in a document or a notes tab in the workbook, with the month and sheet names you change each time.
- In Excel, Copilot supports custom skills that define how it completes a repeatable task, and you can record a skill by demonstrating the task in your workbook. A monthly variance table is a good candidate.
- Keep the same file layout so next month's export drops straight in.
Which AI tool should you use for monthly reports?
Use the tool that sits where your numbers already live. For more options, see our roundup of the best AI tools for Excel and Google Sheets.
- Copilot in Excel. It works inside the workbook and, in Excel on Windows, Mac and the web, has three modes (Microsoft lists fewer modes on iPad, iPhone and Android). Edit mode (the default) changes the workbook directly, plan mode proposes a plan you confirm before it edits, and chat mode analyzes the data without changing the workbook. For a monthly report, chat mode is a safe place to start, and plan mode is useful for building the report sheet for the first time. Copilot can also import data from other workbooks on OneDrive, SharePoint or your computer.
- Gemini in Google Sheets. Open it with Ask Gemini at the top right of a sheet. It can answer questions about the data, build charts and pivot tables, and export an answer to a Google Doc, which is a quick way to start the written report. It requires an eligible Google Workspace or Google AI plan.
- ChatGPT with an uploaded file. It works with .xls, .xlsx and .csv files, and runs Python for calculations. It suits teams that do not use Copilot or Gemini, or that want analysis outside the workbook. Its analysis environment cannot make web requests, so upload everything it needs.
Before you upload financial data anywhere, check your company's settings and policy for that tool. OpenAI points to its data controls and file retention pages for how uploaded files are stored and used, and notes that with connected apps, ChatGPT works with the connected account's permissions and admins can limit which apps are available. Our guide to ChatGPT data controls shows where those settings are.
Common mistakes to avoid
- Vague prompts. "Analyze this" gets a generic answer. Name the month, the comparison and the columns.
- Messy sheets. Subtotals, merged cells and several tables on one sheet confuse every tool.
- Trusting charts after the data changes. AI-made charts in both Excel and Sheets can be static copies. Rebuild them after corrections.
- Letting AI explain causes. It can say what changed. Only you know why.
- Using scans as the source. Use the export from your accounting system, not a PDF of the printed report.
- Skipping the tie-out. If the totals do not match your books, nothing else in the report can be trusted.
Related guides
- Best AI tools for Excel and Google Sheets
- ChatGPT prompts for Excel formulas
- Copilot for Finance skills and plugins
- Best AI tools for data analysis
Sources
- Get started with Copilot in Excel (Microsoft Support)
- Get direct answers to your data analysis questions (Microsoft Support)
- Collaborate with Gemini in Google Sheets (Google Docs Editors Help)
- Generate charts and insights using Gemini in Google Sheets (Google Workspace Updates)
- Data analysis with ChatGPT (OpenAI Help Center)
