
"AI data analyst" is not a separate occupation in the labor data or certificate pages used for this guide. In this guide it means a data analyst who uses AI tools in the work. The core job stays the same: prepare data, analyze it, and explain what it means to the people who make decisions. AI tools can speed up parts of that work, but every result still needs a human check. This guide covers what the role involves, which skills come first, which AI tools analysts use, how to check AI output, where to learn, and what the job data says.
What does an AI data analyst do?
Google's Data Analytics Certificate page says data analysts "prepare, process, and analyze data to help inform business decisions." It adds that they "create visualizations to share their findings with stakeholders and provide recommendations driven by data."
With AI tools, the goal does not change. The workflow does. Instead of writing every query or script from scratch, an analyst can ask an AI tool for a first draft of a SQL query or a Python cleaning script, then review it, fix it, and fit it into the larger analysis.
The closest category in U.S. government data is data scientists. The BLS Occupational Outlook Handbook says data scientists clean raw data so software can read it and use data visualization software to present findings. It lists analytical, computer, communication, logical-thinking, math and problem-solving skills as important qualities. Our reading: an analyst who uses AI does the same work, with one added duty. Because AI tools can return wrong answers, the analyst checks each result before it reaches a decision maker.
Which skills come first?
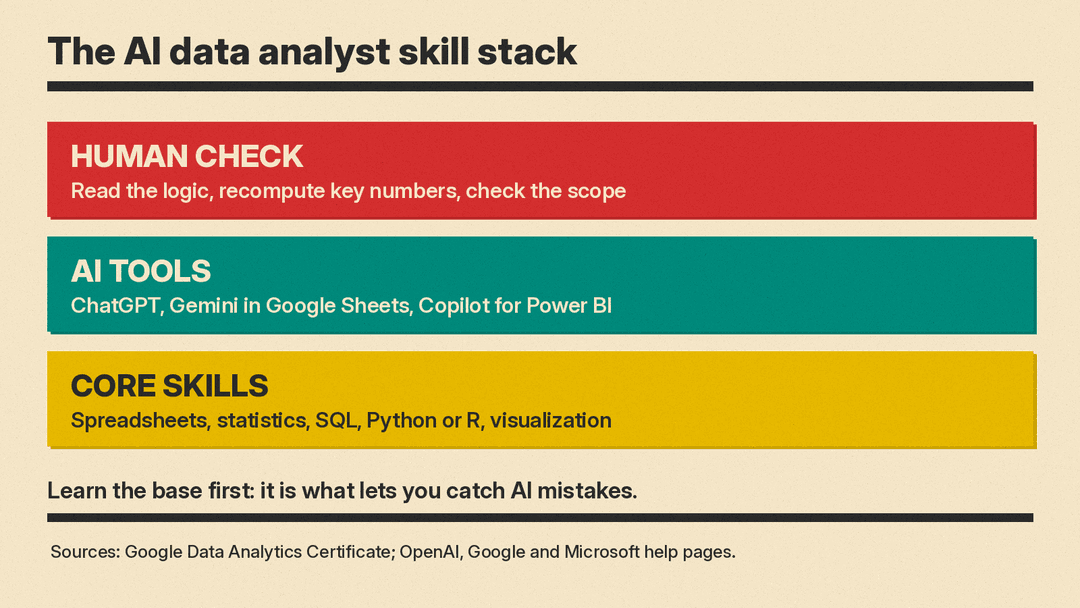
Learn the core data skills before the AI tools. Google's certificate teaches SQL, Python and Tableau, plus how to use AI in data analytics. Another version of the same certificate teaches R in place of Python. Its course list also covers data types and structures, using data to solve problems, and data storytelling with visualizations (Google).
These skills are what let you check the AI. If you cannot read a SQL query, you cannot tell if an AI-written query is correct. If you do not know basic statistics, you cannot tell if an AI summary of a trend holds up.
Our reading of a sensible order:
- Spreadsheets and basic statistics.
- SQL for pulling data from databases.
- Python or R for cleaning and deeper analysis.
- A visualization tool such as Tableau or Power BI.
- Clear writing and speaking about results, alongside all of the above.
Employers rank the thinking side highly. The World Economic Forum's Future of Jobs Report 2025 says analytical thinking is the most sought-after core skill, with seven out of 10 companies considering it essential. Our reading: AI tools can write code, but the analyst still decides which question is worth asking and whether the answer makes sense for the business.
Which AI tools do analysts use?
Three widely available tools have data analysis features documented on their makers' help pages. Each has limits worth knowing (all as of November 2026).
ChatGPT. OpenAI's data analysis help page says ChatGPT can analyze uploaded spreadsheets (.xls, .xlsx, .csv) and text or data files such as .json. It can summarize trends and outliers, build tables and charts, and run Python calculations in a Jupyter notebook environment. OpenAI tells users to review the generated code, outputs and assumptions before relying on the result. The page also says the Python environment cannot make external web requests, that ChatGPT may not reliably extract exact values from image-based tables or scanned files, and that it may pick a method or chart type that does not match your intent on the first try. It recommends descriptive column headers in the first row and one row per record. Our ChatGPT file uploads guide has more.
Gemini in Google Sheets. Google's help page says Gemini in Sheets can create tables and formulas, generate data analysis and insights, build charts, create pivot tables, apply conditional formatting, and analyze large datasets in BigQuery. It requires an eligible Google Workspace or Google AI plan. A "Show code" option shows the code used to generate an output. Google also says Gemini features may suggest inaccurate information.
Copilot for Power BI. Microsoft's overview says Copilot offers chat with your data, DAX generation and report summaries. It needs paid Fabric capacity (F2 or higher) or Power BI Premium (P1 or higher); trial capacities and free SKUs are not supported. Microsoft says that without preparing the semantic model, Copilot can misinterpret the data and return generic or inaccurate results. When a question is not about data in the semantic model, Copilot answers from the large language model's general knowledge.
For a wider list, see our roundup of AI tools for data analysis.
How to check AI output
All three makers say their tools can be wrong. OpenAI says to review code, outputs and assumptions. Google says Gemini may suggest inaccurate information. Microsoft says Copilot can return inaccurate results from an unprepared model. Our reading: treat AI output as a draft, and build checking into every task.
General checks that work with any tool:
- Read the logic. Read any generated SQL or Python line by line. Does it filter the right columns and date range? How does it treat missing values? Do not run code you do not understand.
- Recompute key numbers. If the AI reports a change, recalculate it from the raw data with a simple formula or query and compare.
- Check the scope. Did the tool use the whole dataset or only one tab, table or filtered view? Did it use your data or general knowledge?
- Test on a small sample. Run generated code on a small, known sample first and look for errors or unexpected empty values.
- Write down what you changed. A short note on what the AI produced and what you fixed makes your work easy to review.
Free and paid ways to learn
Kaggle Learn (free). Kaggle Learn says its courses are "provided at no cost to you, and you can now earn certificates." Courses that fit this path include Python, Pandas, Intro to SQL, Advanced SQL, Data Visualization, Data Cleaning, Intro to Machine Learning and Intro to AI Ethics.
Google Data Analytics Certificate (paid, beginner). Google's page says no experience or degree is required and that many learners finish in three to six months. In the U.S. and Canada it costs $49 USD per month after a 7-day free trial, through Coursera (as of November 2026). Google says U.S. graduates get access to CareerCircle, with coaching, mock interviews and resume tools, and can connect with over 150 U.S. employers in its hiring consortium (Google).
Microsoft Power BI Data Analyst Associate, exam PL-300 (paid, intermediate). Microsoft's certification page lists it as intermediate level. The exam assesses four areas: prepare the data, model the data, visualize and analyze the data, and manage and secure Power BI. Candidates should be proficient in Power Query and DAX (Data Analysis Expressions). The exam is proctored and lasts 100 minutes. The price depends on the country where you take it. The certification renews every 12 months, at no cost, by passing an online assessment on Microsoft Learn.
For a broader AI study plan, see our 12-week plan to learn AI from scratch.
What the job market data says
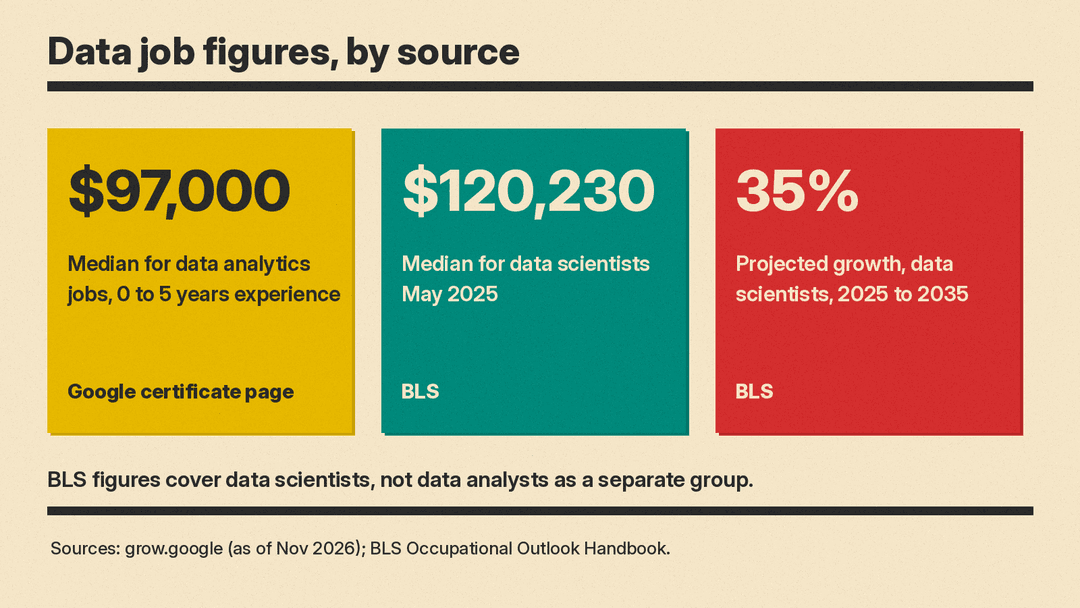
Google's figures. Google's certificate page cites a $97,000 median salary for data analytics jobs with 0 to 5 years of experience and 270,000+ open jobs in data analytics. Job titles it lists: data analyst, junior data analyst, associate data analyst, operations analyst and business systems analyst.
BLS figures for data scientists. The BLS reports a median annual wage of $120,230 for data scientists in May 2025 and 275,600 jobs in 2025. It projects 35 percent employment growth from 2025 to 2035, much faster than the 3 percent average for all occupations, with about 24,800 openings a year. Data scientists typically need at least a bachelor's degree in mathematics, statistics, computer science or a related field, and some employers require or prefer a master's or doctoral degree. These figures cover data scientists, not data analysts as a separate group.
WEF survey. The Future of Jobs Report 2025 draws on over 1,000 employers. It lists Big Data Specialists among the fastest-growing jobs in percentage terms and says AI and big data top the list of fastest-growing skills. Two-thirds of employers plan to hire talent with specific AI skills. Data Entry Clerks are among the fastest-declining roles.
For pay in other AI roles, see our look at AI engineer salary data.
A step-by-step plan to start
This plan is our reading of the sources above, not an official path.
Build the foundation. Take free SQL and Python courses, for example on Kaggle Learn. Practice until you can write simple queries and scripts without help. Learn basic statistics such as mean, median, standard deviation and correlation.
Learn one visualization tool. Google's certificate teaches Tableau. Microsoft's certification covers Power BI. Pick one, build dashboards from public datasets, and practice explaining what each chart shows.
Add AI tools. Use ChatGPT or Gemini in Sheets to draft code and explore data. Check every output with the methods in the checking section above, and keep notes on what you fixed.
Build a portfolio project. Take a public dataset, clean it, analyze it, chart it and write up the findings. Add a short section on how you used AI and how you checked it. Our portfolio guide covers how to present projects.
Apply. Search for the titles Google lists, such as junior data analyst, associate data analyst and operations analyst. Point your resume at your projects, and practice explaining how you handled messy data.
Keep current. Tool features change. Check the help pages of the tools you use, and consider a certification such as PL-300 once you work with Power BI.
Bottom line
An AI data analyst is a data analyst who uses AI tools. SQL, Python or R, statistics, visualization and clear communication still come first, because they are what let you catch AI mistakes. ChatGPT, Gemini in Sheets and Copilot for Power BI can speed up drafting and exploration, and each maker says its tool can be wrong. You can start with free Kaggle courses or Google's paid certificate, which says no degree is required. BLS data for the closest category, data scientists, shows 35 percent projected growth from 2025 to 2035 and a typical bachelor's degree requirement.
Sources
- Google Data Analytics Certificate
- BLS Occupational Outlook Handbook: Data Scientists
- World Economic Forum: The Future of Jobs Report 2025
- OpenAI Help Center: Data analysis with ChatGPT
- Google Docs Editors Help: Collaborate with Gemini in Google Sheets
- Microsoft Learn: Copilot for Power BI overview
- Microsoft Learn: Power BI Data Analyst Associate certification
- Kaggle Learn
