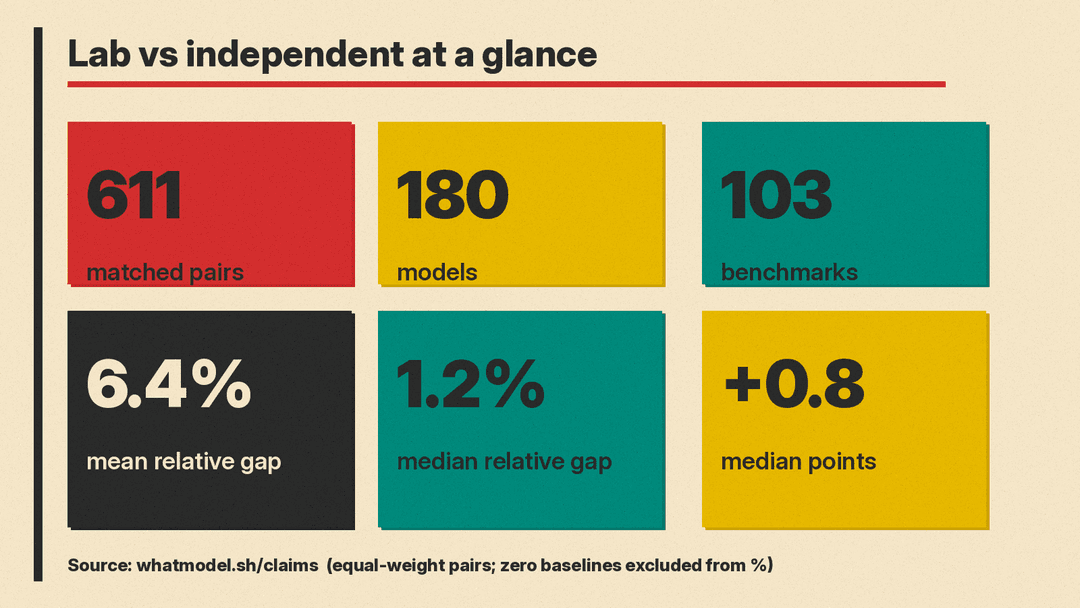
A new open dataset from whatmodel.sh compares lab-published benchmark scores with independent measurements of the same models on the same tests. Across 611 matched pairs, covering 180 models and 103 benchmarks, lab scores are 6.4% higher on average than the independent result.
The project is open source. The data is CC BY-SA 4.0 and the code is MIT, on GitHub. The author, Jake Manger, posted the finding on r/LocalLLaMA on 19 October 2026.
How the gap is measured
Each pair is one model on one test where the maker published a score and someone else measured it too: a leaderboard, a paper, Epoch AI, or another lab. The gap for each pair is:
(lab score − independent score) ÷ independent score × 100
Those percentages are averaged with equal weight per pair. Zero baselines are excluded because a relative percentage cannot be defined. That leaves 611 pairs with a nonzero independent baseline, drawn from 1,629 published results.
Important caveats from the site:
- The median percentage difference is 1.2%, not 6.4%. A few large outliers pull the mean up. The mean's 95% interval, resampling whole models, is 3.8% to 9.5%.
- When scores differ, the lab is higher 63% of the time (375 lab higher, 216 independent higher, 20 exact ties). Including ties, the lab is higher 61% of the time.
- The median point gap across all pairs (including ties) is +0.8 points on each test's own scale.
Gaps are not pure inflation. Settings often differ: reasoning effort, agent harness, few-shot prompts, test subset or version. Labs also choose which tests to publish, so the pairs are not a random sample of all possible evaluations.
Where the gaps are largest
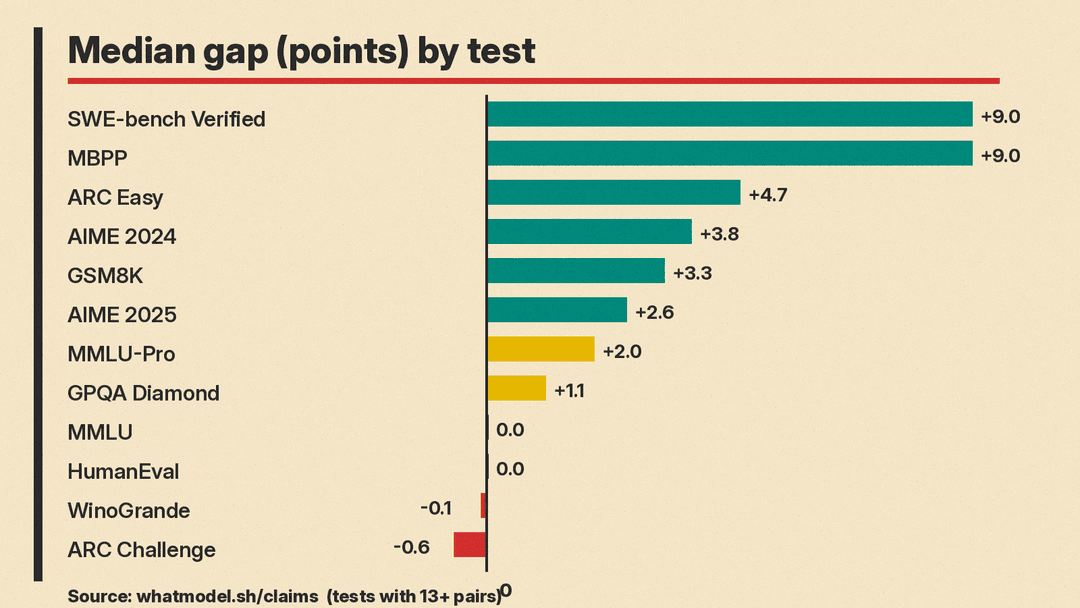
Fixed-format standard tests barely move. MMLU, WinoGrande, ARC Challenge, and HumanEval show median gaps near zero. Tests where the setup is part of the result show the biggest gaps.
Among tests with 13 or more pairs (from the site's "By test" table):
- SWE-bench Verified: 13 pairs, median gap +9.0, maker higher 92% of the time
- MBPP: 13 pairs, median +9.0, maker higher 77%
- ARC Easy: 14 pairs, median +4.7, maker higher 79%
- AIME 2024: 14 pairs, median +3.8, maker higher 86%
- GSM8K: 19 pairs, median +3.3, maker higher 84%
- AIME 2025: 20 pairs, median +2.6, maker higher 70%
- MMLU-Pro: 29 pairs, median +2.0, maker higher 69%
- GPQA Diamond: 51 pairs, median +1.1, maker higher 67%
- MMLU: 20 pairs, median 0.0, maker higher 50%
- HumanEval: 34 pairs, median 0.0, maker higher 47%
- WinoGrande: 25 pairs, median -0.1, maker higher 40%
- ARC Challenge: 14 pairs, median -0.6, maker higher 50%
The site names the setup choices behind those gaps: the agent harness on SWE-bench Verified, sampling and reasoning budget on AIME, and few-shot prompting on GSM8K and MBPP. Agent scores in particular change with the harness that wraps the model. Agent self-reports need outside checks too: in a new benchmark of research agents, 114 of 135 agent-written papers failed an integrity check.
Who looks high and who looks low
The site also breaks pairs down by maker (groups with 10 or more pairs). Small groups swing a lot; treat these as rough:
- Alibaba Cloud: 148 pairs, median gap +1.1, maker higher 61%
- Meta: 89 pairs, median +0.7, maker higher 62%
- Google: 48 pairs, median +1.6, maker higher 60%
- DeepSeek: 46 pairs, median +0.8, maker higher 70%
- OpenAI: 36 pairs, median +0.5, maker higher 58%
- Anthropic: 12 pairs, median +1.6, maker higher 75%
- Mistral AI: 20 pairs, median +1.6, maker higher 75%
- BigScience: 20 pairs, median -11.9, maker higher only 10%
Against neutral testers (leaderboards, Epoch AI, papers that do not release a model), the maker is higher in 56% of 236 pairs. Against rival labs' release documents, 63% of 446. Where a rival and a neutral tester measured the same model on the same test (272 cases), the rival was lower 131 times and higher 130 times (median 0.0). Rival-lab numbers do not systematically undercut the maker more than neutrals do.
Extreme single pairs exist. Examples the site lists near the top of the maker-advantage table include Molmo 7B-D on ChartQA (84.1 lab vs 27.0 independent, +57.1 points), Qwen2-VL 7B Instruct on ChartQA (83.0 vs 41.2), and gpt-oss-120b on SWE-bench Verified (62.4 vs 31.0). Those are outliers; the median story is nearer +0.8 points. Single launches can show the same pattern, as when independent testing put Qwen 3.8-Max behind Alibaba's own claims.
What this means for reading model cards
Three practical takeaways for engineers:
- Prefer median over mean. The 6.4% average is real as a summary of the matched set, but the 1.2% median and +0.8 point median gap better describe a typical pair. Small gaps matter because top models often sit within a few points of each other on public benchmarks.
- Trust fixed-format scores more than harness scores. MMLU and HumanEval track closely. SWE-bench Verified, AIME with a reasoning budget, and GSM8K or MBPP with few-shot settings do not.
- Check who ran the independent number. When a rival lab and a neutral tester both scored the same model on the same test, the rival came in lower about as often as higher (131 times vs 130). Link both sources when you publish a comparison.
The site is clear that scores can be incomplete, out of date, or wrong, and are not endorsed by the makers. Hover any dot on whatmodel.sh/claims for both sources.