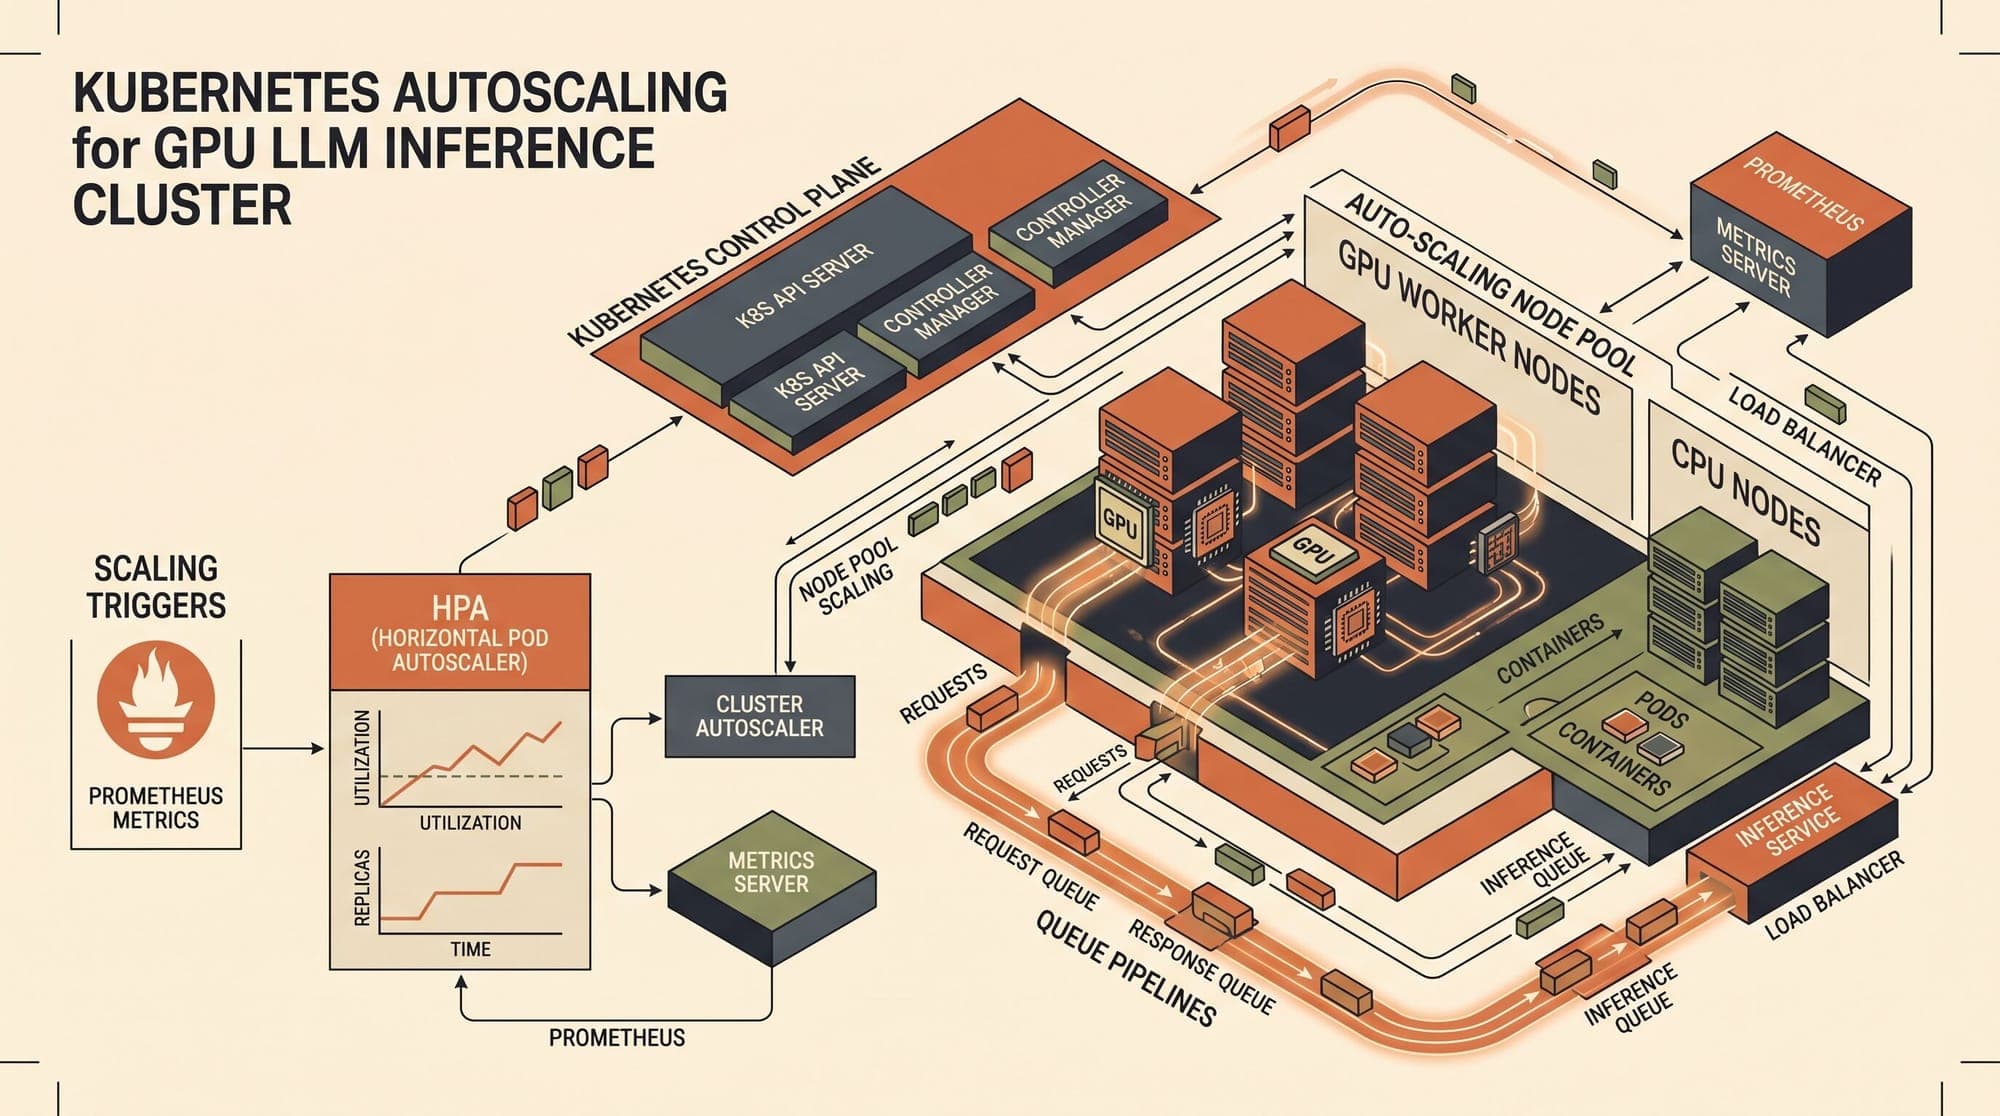
Autoscaling large language model workloads on Kubernetes presents a fundamentally different engineering problem than traditional stateless microservices. While web APIs scale on CPU utilization or request rate within seconds, LLM inference instances require specialized GPU accelerators, massive container images, multi-gigabyte weight tensors, and intensive runtime compilation before serving a single token.
Without proactive architectural design, a cold-starting LLM pod on Kubernetes often requires between 5 and 10 minutes to transition from scheduled to ready. When unpredictable traffic spikes hit an inference cluster, scaling latencies of this magnitude cause request queue explosions, severe time-to-first-token (TTFT) degradation, and broken service-level objectives (SLOs).
Achieving responsive, cost-effective GPU autoscaling requires understanding the anatomy of an LLM cold start, instrumenting application-layer queue metrics with KEDA, and eliminating storage bottlenecks through tiered caching.

The Anatomy of an LLM Cold Start
A cold start in Kubernetes inference infrastructure spans five sequential phases, each governed by distinct hardware and kernel bottlenecks:
- Node Provisioning and Driver Initialization (120 to 300 seconds): If the cluster lacks unallocated GPU capacity, node autoscalers such as Karpenter or Kubernetes Cluster Autoscaler must provision virtual machines or bare-metal cloud instances. The host must boot, register with the Kubernetes control plane, initialize NVIDIA kernel modules, and verify GPU health via device plugins.
- Container Image Distribution (60 to 240 seconds): Production inference containers containing CUDA runtimes, PyTorch binaries, custom kernel libraries (such as FlashInfer or Triton), and engine dependencies (vLLM, SGLang, or TGI) frequently exceed 15 to 25 GB. Uncached layer downloads and decompression saturate node network bandwidth and disk I/O.
- Weight Transfer to Host Storage (30 to 180 seconds): Model weights must be retrieved from object storage (such as Amazon S3 or Google Cloud Storage) or network filesystems (such as NFS or AWS EFS). A 70-billion parameter model in FP16 precision requires approximately 140 GB of raw weights; even an 8-billion parameter model requires 16 GB. Standard network file shares often limit read throughput to 100 to 250 MB/s, creating severe serialization delays.
- Host RAM to GPU VRAM Loading (5 to 40 seconds): Once stored locally, tensors are deserialized and copied across the PCIe bus (typically PCIe Gen4 or Gen5 at 32 to 64 GB/s per link) into high-bandwidth GPU memory (HBM).
- Runtime Engine Warmup and CUDA Graph Capture (15 to 60 seconds): Modern serving runtimes pre-allocate GPU memory for the PagedAttention key-value (KV) cache and compile CUDA graphs for multiple discrete batch sizes (e.g., batch sizes 1, 2, 4, 8, 16, 32) to eliminate kernel launch overhead during generation.
Cumulative cold starts across unoptimized layers routinely exceed 8 minutes. Production autoscaling architectures must systematically compress each phase.
Why Hardware Metrics Fail for Inference Autoscaling
Traditional Kubernetes Horizontal Pod Autoscalers (HPAs) evaluate CPU utilization, memory thresholds, or raw GPU core activity reported by the NVIDIA Data Center GPU Manager (DCGM). In modern LLM serving, these metrics provide misleading demand signals.
Modern inference engines utilize continuous batching (iteration-level scheduling). When an engine processes even a single active request, execution loops continuously saturate GPU Tensor Cores, reporting near 100% GPU core utilization (DCGM_FI_DEV_GPU_UTIL). Conversely, a saturated pod with 50 requests waiting in its internal scheduler queue exhibits the same GPU utilization profile as a pod processing 2 requests. Scaling on GPU core percentage leads to premature scale-up under light loads and delayed scale-up during severe traffic bursts.
Effective LLM autoscaling requires application-layer metrics exposed by the serving engine:
- Queue Depth (
vllm:num_requests_waiting): The exact count of requests waiting in the engine's scheduling queue because KV cache memory or compute slots are fully occupied. Any value greater than zero indicates that demand exceeds current serving capacity. - KV Cache Utilization (
vllm:gpu_cache_usage_perc): The percentage of allocated PagedAttention memory blocks currently assigned to active sequences. Approaching 100% signals imminent request preemption or queuing. - Time to First Token (
vllm:time_to_first_token_seconds/ p95 TTFT): Direct latency telemetry indicating whether prefill saturation is breaching user-facing SLOs.
Production Autoscaling Architecture with KEDA
Kubernetes Event-Driven Autoscaling (KEDA) provides native Prometheus metric integration, decoupling inference scaling from blunt hardware counters. By querying engine-level metrics directly, KEDA drives the underlying HPA with microsecond-level accuracy.
apiVersion: keda.sh/v1alpha1
kind: ScaledObject
metadata:
  name: vllm-llama3-scaledobject
  namespace: inference
spec:
  scaleTargetRef:
    apiVersion: apps/v1
    kind: Deployment
    name: vllm-llama3-70b
  minReplicaCount: 2
  maxReplicaCount: 10
  cooldownPeriod: 300
  pollingInterval: 15
  advanced:
    horizontalPodAutoscalerConfig:
      behavior:
        scaleUp:
          stabilizationWindowSeconds: 0
          policies:
            - type: Percent
              value: 100
              periodSeconds: 15
        scaleDown:
          stabilizationWindowSeconds: 300
          policies:
            - type: Pods
              value: 1
              periodSeconds: 120
  triggers:
    - type: prometheus
      metricType: AverageValue
      metadata:
        serverAddress: http://prometheus-k8s.monitoring.svc:9090
        query: sum(vllm:num_requests_waiting{namespace="inference", model="llama3-70b"}) or vector(0)
        threshold: "5"
        activationThreshold: "1"
Scaling Rules and Anti-Flapping Policies
Inference deployments require asymmetric scaling policies:
- Aggressive Scale-Up: Setting
stabilizationWindowSeconds: 0allows immediate pod creation the moment queue depth crosses the target threshold. If queue depth surges, KEDA can double replicas within 15 seconds. - Conservative Scale-Down: GPU pods represent high initialization investments. Setting a 300-second stabilization window and limiting scale-down to 1 pod per 120 seconds prevents rapid thrashing (flapping), ensuring that temporary lulls do not discard warm GPU contexts that might be required seconds later.
- Activation Thresholds: The
activationThreshold: "1"parameter prevents the scaler from engaging while traffic remains within the headroom of existing baseline replicas, preventing unnecessary cluster churn.
Eliminating the Storage and Ingestion Bottleneck
Weight retrieval is the largest reducible variable in cold start duration. Relying on remote object store downloads or shared network filesystems on every pod startup introduces severe latency and network saturation.
+-------------------------------------------------------------------------+
|                  Storage Architecture Comparison                        |
+----------------------+--------------------+-----------------------------+
| Storage Tier         | Read Throughput    | 70B FP16 Load Time (140 GB) |
+----------------------+--------------------+-----------------------------+
| Standard AWS EFS     | 100 - 250 MB/s     | 9.3 - 23.3 minutes          |
| Multi-Threaded S3    | 800 - 1,500 MB/s   | 1.5 - 2.9 minutes           |
| Local NVMe (Direct)  | 3,500 - 6,000 MB/s | 23 - 40 seconds             |
| Host Pinned Memory   | 25,000+ MB/s       | 5 - 6 seconds               |
+----------------------+--------------------+-----------------------------+
1. Local NVMe Instance Storage via HostPath Caching
Cloud GPU instances (such as AWS g6, p4de, p5 or GCP a2, a3) often feature direct-attached NVMe SSDs capable of multi-gigabyte sequential read bandwidth. Using Kubernetes DaemonSets or node initialization scripts to pre-populate common model weights on local NVMe instance disks allows inference pods to mount weights via hostPath volumes.
When coupled with the safetensors format, vLLM utilizes memory-mapped I/O (mmap), allowing the OS page cache to map tensors directly without PyTorch pickle deserialization or redundant RAM allocations.
2. Distributed Caching Runtimes (Fluid and JuiceFS)
For clusters where local NVMe disks cannot maintain full model catalogues, data orchestration layers like Fluid (using JuiceFS or Alluxio backends) present a distributed caching layer. Fluid abstracts cloud object storage behind a POSIX filesystem interface that automatically caches hot weight chunks across cluster nodes' local NVMe drives. Repeated pod initializations pull from local node caches rather than re-downloading across internet gateways.
3. Container Image Pre-Warming and P2P Distribution
To compress the container distribution phase:
- Peer-to-Peer (P2P) Distribution: Tools like Spegel and Dragonfly convert cluster nodes into a distributed cache for container layers. When a new node joins, it fetches image layers directly from neighboring nodes over high-speed intra-VPC networks rather than querying an external container registry.
- Lazy Image Pulling (eStargz / SOCI): Seekable OCI (SOCI) and eStargz format container images to allow startup before all layers are fully downloaded. The container runtime streams files on demand, allowing the entrypoint process to initialize while non-critical binaries load in the background.
Accelerated Node Provisioning with Karpenter
When scaling demands new physical nodes, standard Kubernetes Cluster Autoscaler introduces 2 to 4 minutes of node provisioning latency due to slow node group evaluation and ASG lifecycle hooks.
Karpenter bypasses node group abstraction by communicating directly with cloud provider APIs to provision bare instances matched to pod specifications in under 45 seconds.
apiVersion: karpenter.sh/v1beta1
kind: NodePool
metadata:
  name: gpu-inference-pool
spec:
  template:
    spec:
      nodeClassRef:
        name: gpu-nodeclass
      requirements:
        - key: node.kubernetes.io/instance-type
          operator: In
          values: ["g6e.12xlarge", "g5.12xlarge", "p4d.24xlarge"]
        - key: karpenter.sh/capacity-type
          operator: In
          values: ["on-demand"]
      taints:
        - key: nvidia.com/gpu
          value: "true"
          effect: NoSchedule
  disruption:
    consolidationPolicy: WhenEmpty
    consolidateAfter: 10m
Overprovisioning Buffers (Pause Pods)
To achieve instantaneous scale-out without paying the node provisioning tax during a spike, high-throughput architectures deploy low-priority "pause pods."
These placeholder pods allocate GPU capacity but execute no work, running with a low PriorityClass. When incoming request traffic spikes and KEDA triggers high-priority inference pod creation, the Kubernetes scheduler immediately evicts the pause pods, placing new inference containers on existing, pre-warmed GPU nodes in seconds. The evicted pause pods then trigger Karpenter to provision replacement background nodes asynchronously.
Architectural Trade-Offs
Optimizing Kubernetes LLM autoscaling requires deliberate trade-offs across cost, latency, and operational complexity:
- Scale-to-Zero vs. Baseline Headroom: True scale-to-zero eliminates idle GPU expense but guarantees multi-minute cold starts on the first request. Production architectures maintain a fixed baseline of warm replicas to service normal baseline traffic, using autoscalers exclusively for peak variance.
- Persistent Shared Storage vs. Ephemeral Local Disks: Centralized shared storage (NFS) simplifies model rollout but throttles I/O during concurrent scale-out. Local NVMe caching maximizes read speed but requires automated cache invalidation pipelines when model weights update.
- CUDA Graph Warmup vs. Startup Latency: Pre-compiling exhaustive CUDA graph batch buckets adds 30 to 60 seconds to pod initialization but prevents runtime jitter during generation. Production deployments restrict graph capture to expected operational batch buckets to balance startup speed with inference throughput.