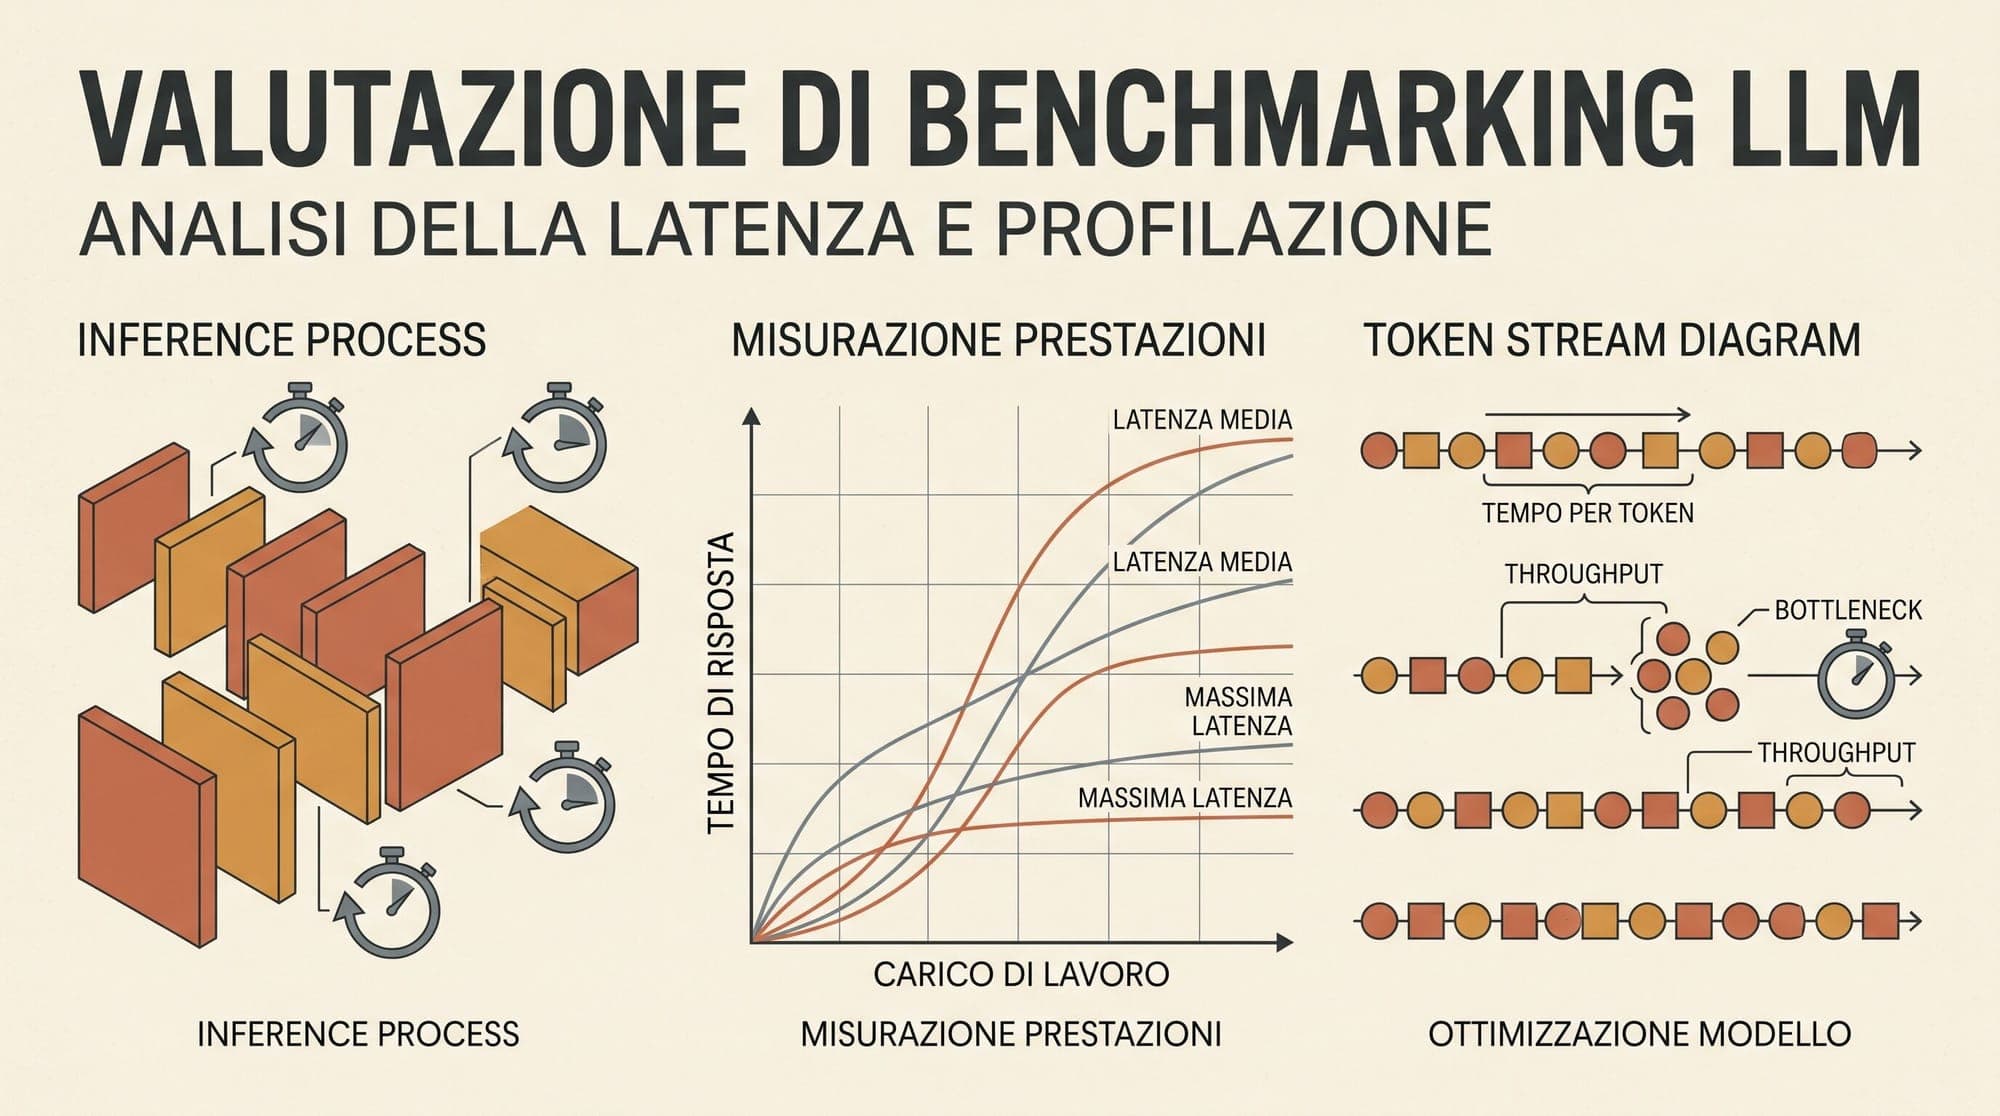
Traditional HTTP load-testing tools such as Apache Bench, wrk, and Locust evaluate systems using uniform request-response cycles. These tools send a payload, wait for the full response, and compute metrics such as requests per second (RPS) and round-trip latency percentiles. For stateless REST APIs, this model aligns directly with user experience.
Large language model (LLM) serving fundamentally breaks this abstraction. An inference request is not an atomic computation. It consists of two distinct phases with opposite computational characteristics: a compute-bound prompt prefill phase that processes all input tokens in parallel, followed by a memory-bandwidth-bound autoregressive decoding phase that emits one token per forward pass across multiple seconds.
Evaluating an LLM serving cluster with traditional HTTP metrics creates blind spots that lead to severe capacity miscalculations. A cluster reporting high aggregate requests per second can simultaneously deliver an unusable user experience characterized by multi-second delays before the first word appears, erratic streaming pauses, and degraded token generation rates.
Accurately profiling LLM inference infrastructure requires specialized client-side benchmarking frameworks that parse server-sent event (SSE) token streams, record millisecond-level timestamps per token chunk, model realistic arrival distributions, and isolate prefill performance from decode dynamics.

The LLM Serving Metric Taxonomy
To evaluate an inference runtime (such as vLLM, SGLang, or TensorRT-LLM) or a cloud inference endpoint, engineers rely on a specific taxonomy of token-level telemetry.
Time to First Token (TTFT)
Time to First Token measures the duration from when the client transmits the request to when the client receives the first generated token. Mathematically, it encompasses three discrete phases:
- Client and Network Overhead: DNS resolution, TCP handshake, TLS negotiation, and request transmission.
- Scheduling and Queue Latency: Time spent waiting in the server-side queue for available KV cache memory slots or execution batch slots.
- Prompt Prefill Computation: The parallel matrix multiplications required to compute the key-value tensors across all prompt tokens and generate the initial output logits.
Because prefill compute scales quadratically or linearly with input context length depending on the attention implementation, TTFT directly reflects prompt length and system queuing pressure. In conversational applications, TTFT determines the user's perception of responsiveness.
Time to Second Token (TTST)
A newer metric tracked in modern benchmark suites like NVIDIA AIPerf is Time to Second Token. TTST captures the interval between the arrival of the first token and the arrival of the second token.
While subsequent decode steps typically maintain uniform timing, the step between token 1 and token 2 often exhibits a latency spike. This delay stems from the transition between the prefill engine and the decode engine, initial KV cache block allocation in paged memory architectures, or context migration in chunked-prefill schedules. Isolating TTST prevents these one-time allocation costs from distorting steady-state decoding measurements.
Inter-Token Latency (ITL) and Time Per Output Token (TPOT)
Inter-Token Latency, also referred to as Time Per Output Token, measures the time elapsed between consecutive tokens during the autoregressive generation phase:
ITL_i = Timestamp(Token_i) - Timestamp(Token_{i-1}) for all i > 1
Average ITL defines the steady-state streaming velocity. For interactive applications, humans read comfortably at approximately 5 to 10 tokens per second (100 ms to 200 ms ITL). Fast skimming or agentic workflows often demand 30 to 80+ tokens per second (12 ms to 33 ms ITL).
Unlike TTFT, which is compute-bound by batch matrix multiplication, ITL is constrained by GPU High Bandwidth Memory (HBM) bandwidth. Each decode step requires transferring the entire model weight tensor from HBM into on-chip SRAM to generate a single token per sequence in the batch.
End-to-End Latency vs. Output Token Throughput
End-to-End (E2E) latency measures total elapsed time from request dispatch to the final EOS token:
E2E Latency = TTFT + SUM(ITL_i)
Output token throughput measures the aggregate volume of tokens generated across all concurrent active requests per unit of time:
Throughput = Total Generated Output Tokens / Benchmark Duration (seconds)
Serving systems face an unavoidable trade-off between individual user latency and aggregate cluster throughput. Increasing batch size raises hardware utilization and overall token throughput, but increases ITL and TTFT as memory bandwidth is divided among more concurrent sequences.
Goodput: SLO-Constrained Throughput
Raw token throughput is an incomplete metric for capacity planning. An inference cluster operating at maximum GPU saturation might output 10,000 tokens per second, but if 60% of those requests suffer a TTFT exceeding 3 seconds or an ITL above 300 ms, the system is unusable for interactive workloads.
Modern benchmarking tools formalize this distinction via Goodput. Goodput defines the rate of completed requests or generated tokens that strictly comply with predefined Service Level Objectives (SLOs). For instance, an engineer might specify:
- Maximum allowable TTFT (P95 < 500 ms)
- Maximum allowable ITL (P95 < 40 ms)
Only requests that satisfy both criteria are counted toward the system's goodput. The inflection point where goodput diverges from raw throughput marks the boundary of stable capacity.
Workload Modeling: Arrival Distributions and Sequence Variance
Synthetic benchmarks that use fixed-size prompts and static concurrency produce misleadingly optimistic results. Accurate LLM benchmarking requires realistic workload simulation.
Closed Systems vs. Open Systems
Traditional benchmarking scripts often implement a closed system model, maintaining a fixed concurrency (such as 16 or 64 parallel virtual users). In a closed system, a virtual user only dispatches request N+1 after receiving the complete response for request N. If the inference server slows down, the request rate automatically throttles. This prevents queuing runaways and masks latency collapse.
Production traffic behaves as an open system, where incoming requests arrive independently of the server's internal state. When user traffic spikes, requests continue arriving even if the server is congested.
Benchmarking frameworks model open systems using Poisson arrival processes, where request inter-arrival times follow an exponential distribution parameterized by a target request rate (lambda). Open-system benchmarking reveals whether a serving framework's request scheduler gracefully rejects traffic, enqueues requests, or suffers memory exhaustion under load.
Input Sequence Length (ISL) and Output Sequence Length (OSL) Distributions
Fixed token lengths (for example, exactly 512 input tokens and 128 output tokens) fail to test three critical runtime subsystems:
- KV Cache Fragmentation: Variable sequence lengths trigger dynamic memory block allocations and deallocations in frameworks using PagedAttention, exposing virtual memory management overheads.
- Chunked Prefill Scheduling: Varying input sizes stress the runtime's ability to interleave heavy prefill compute with lightweight decode steps in continuous batching loops.
- Prompt Cache Reuse: Real workloads often share system prompts, few-shot examples, or document context. Evaluating prefix caching requires benchmarks to draw from corpus datasets with configurable prefix sharing rates.
Production LLM Benchmarking Frameworks
Three prominent open-source tools dominate the production LLM benchmarking landscape: NVIDIA AIPerf, vLLM GuideLLM, and Ray LLMPerf.
1. NVIDIA AIPerf (formerly GenAI-Perf)
NVIDIA AIPerf is a production-grade inference benchmarking engine developed by NVIDIA. Built on a modular multiprocess architecture coordinated via ZeroMQ, AIPerf generates high-rate streaming traffic without introducing client-side Python GIL bottlenecks.
Key architectural capabilities include:
- Automated SLA Boundary Sweeps: AIPerf includes search recipes (such as
max-throughput-ttft-slaandpareto-sweep) that automatically modulate concurrency and arrival rates until the system discovers the precise throughput ceiling before an SLO breach. - Microsecond HTTP Tracing: Deconstructs network-level time to first byte (TTFB), TLS handshake, and token chunk delivery timings.
- Hardware Telemetry Integration: Collects GPU utilization, power draw, and tensor core activity directly through Data Center GPU Manager (DCGM) during execution runs.
- Streaming Parser: Disregards initial empty HTTP streaming chunks to prevent skewing TTFT calculations.
2. vLLM GuideLLM
GuideLLM is an SLO-aware evaluation tool developed within the vLLM ecosystem (originally created by Neural Magic and Red Hat). It focuses on simulating real-world production distributions and establishing deployment guidelines for Kubernetes and KServe environments.
Key architectural capabilities include:
- Automated Rate Sweeps: Executes progressive multi-round sweeps starting from a zero-contention baseline up to saturation, plotting throughput-latency curves across intermediate load levels.
- Statistical Saturation Detection: Monitors queue growth and token latency variance to automatically terminate benchmark runs once statistical confidence is reached.
- Dataset-Driven Workloads: Supports loading Hugging Face datasets directly to replay real token distributions rather than relying purely on synthetic token generation.
- Interactive Visual Reporting: Emits standalone interactive HTML and CSV reports containing complete percentile distributions (P50, P90, P95, P99) for TTFT and ITL.
3. Ray LLMPerf and llmperf-rs
Ray LLMPerf is an established distributed benchmarking tool built on the Ray actor framework. It distributes virtual user workloads across multiple worker nodes, making it suitable for load-testing massive hyperscale inference clusters that exceed single-machine network limits.
Recent community evolutions, including Rust-based rewrites like llmperf-rs, address client-side timing jitter by handling HTTP streaming connections and SSE chunk timestamping in native compiled code.
Architectural Comparison of LLM Benchmarking Frameworks
The following summary outlines the structural differences among the major benchmarking suites:
- NVIDIA AIPerf: Written in Python with multiprocess ZeroMQ architecture. Supports OpenAI-compatible, Triton, and NIM endpoints. Features Poisson and concurrency-based load generation, automated Pareto and SLA boundary sweeps, DCGM GPU telemetry, and built-in Goodput calculation.
- vLLM GuideLLM: Written in Python with asynchronous event loops. Supports OpenAI-compatible and vLLM-native endpoints. Features multi-round rate sweeps and synthetic/HF dataset replay, automatic saturation detection, interactive HTML and CSV reporting, and built-in Goodput calculation.
- Ray LLMPerf: Written in Python on the Ray actor runtime (with Rust alternatives). Supports OpenAI-compatible and custom endpoints. Features distributed multi-node load generation, custom script profiling, and JSON report exports.
Constructing Throughput-Latency Pareto Frontiers
The ultimate deliverable of an LLM benchmarking run is a Throughput-Latency Pareto Frontier.
To build a Pareto curve, an engineer sweeps concurrency from 1 up to saturation while recording TTFT (P95), ITL (P95), and total Output Tokens per Second.
At low concurrency levels (1 to 4 requests), the GPUs operate below full compute capacity. Latency remains low and flat, while throughput scales linearly with load.
As concurrency increases into the optimal operating zone, batching efficiency rises. The continuous batching scheduler packs multiple sequences into tensor cores during prefill and amortizes memory bandwidth across multiple decode sequences. Throughput continues to climb while latency rises moderately.
Beyond the saturation threshold (the knee of the curve), GPU compute and memory capacity are fully exhausted. Additional incoming requests stall in the server queue. TTFT explodes exponentially due to queuing delays, and ITL spikes as the scheduler runs out of KV cache blocks and is forced to preempt or recompute active requests.
Operating an LLM cluster directly on the knee of the Pareto frontier maximizes hardware cost efficiency while preventing tail-latency collapses.
Benchmarking Disaggregated Prefill and Decode Architectures
As production serving architectures split into disaggregated clusters (where specialized compute-heavy nodes handle prefill and memory-heavy nodes handle decode), benchmarking methodology must adapt.
In a disaggregated setup, benchmarking suites must trace:
- Prefill Node TTFT: Isolates prompt processing time and KV tensor computation.
- KV Cache Transfer Latency: Measures the network transmission time required to transfer serialized KV cache state over high-speed interconnects (such as RDMA or PCIe-over-fabric) from prefill workers to decode workers.
- Decode Node ITL: Evaluates pure autoregressive generation stability free from prefill compute interference.
Client-side benchmarking tools equipped with detailed HTTP trace metrics and TTST monitoring allow infrastructure teams to pinpoint whether latency bottlenecks originate in prompt scheduling, cross-node KV transfer, or memory bandwidth saturation.
Sources
- NVIDIA AIPerf Repository and Architecture Documentation
- NVIDIA Technical Blog: LLM Performance Benchmarking with GenAI-Perf
- vLLM Project: GuideLLM Benchmark Suite
- Red Hat Developer: GuideLLM: Evaluate LLM Deployments for Real-World Inference
- Ray Project: LLMPerf Benchmark Framework
- NVIDIA NIM LLMs Benchmarking: Metrics Reference