
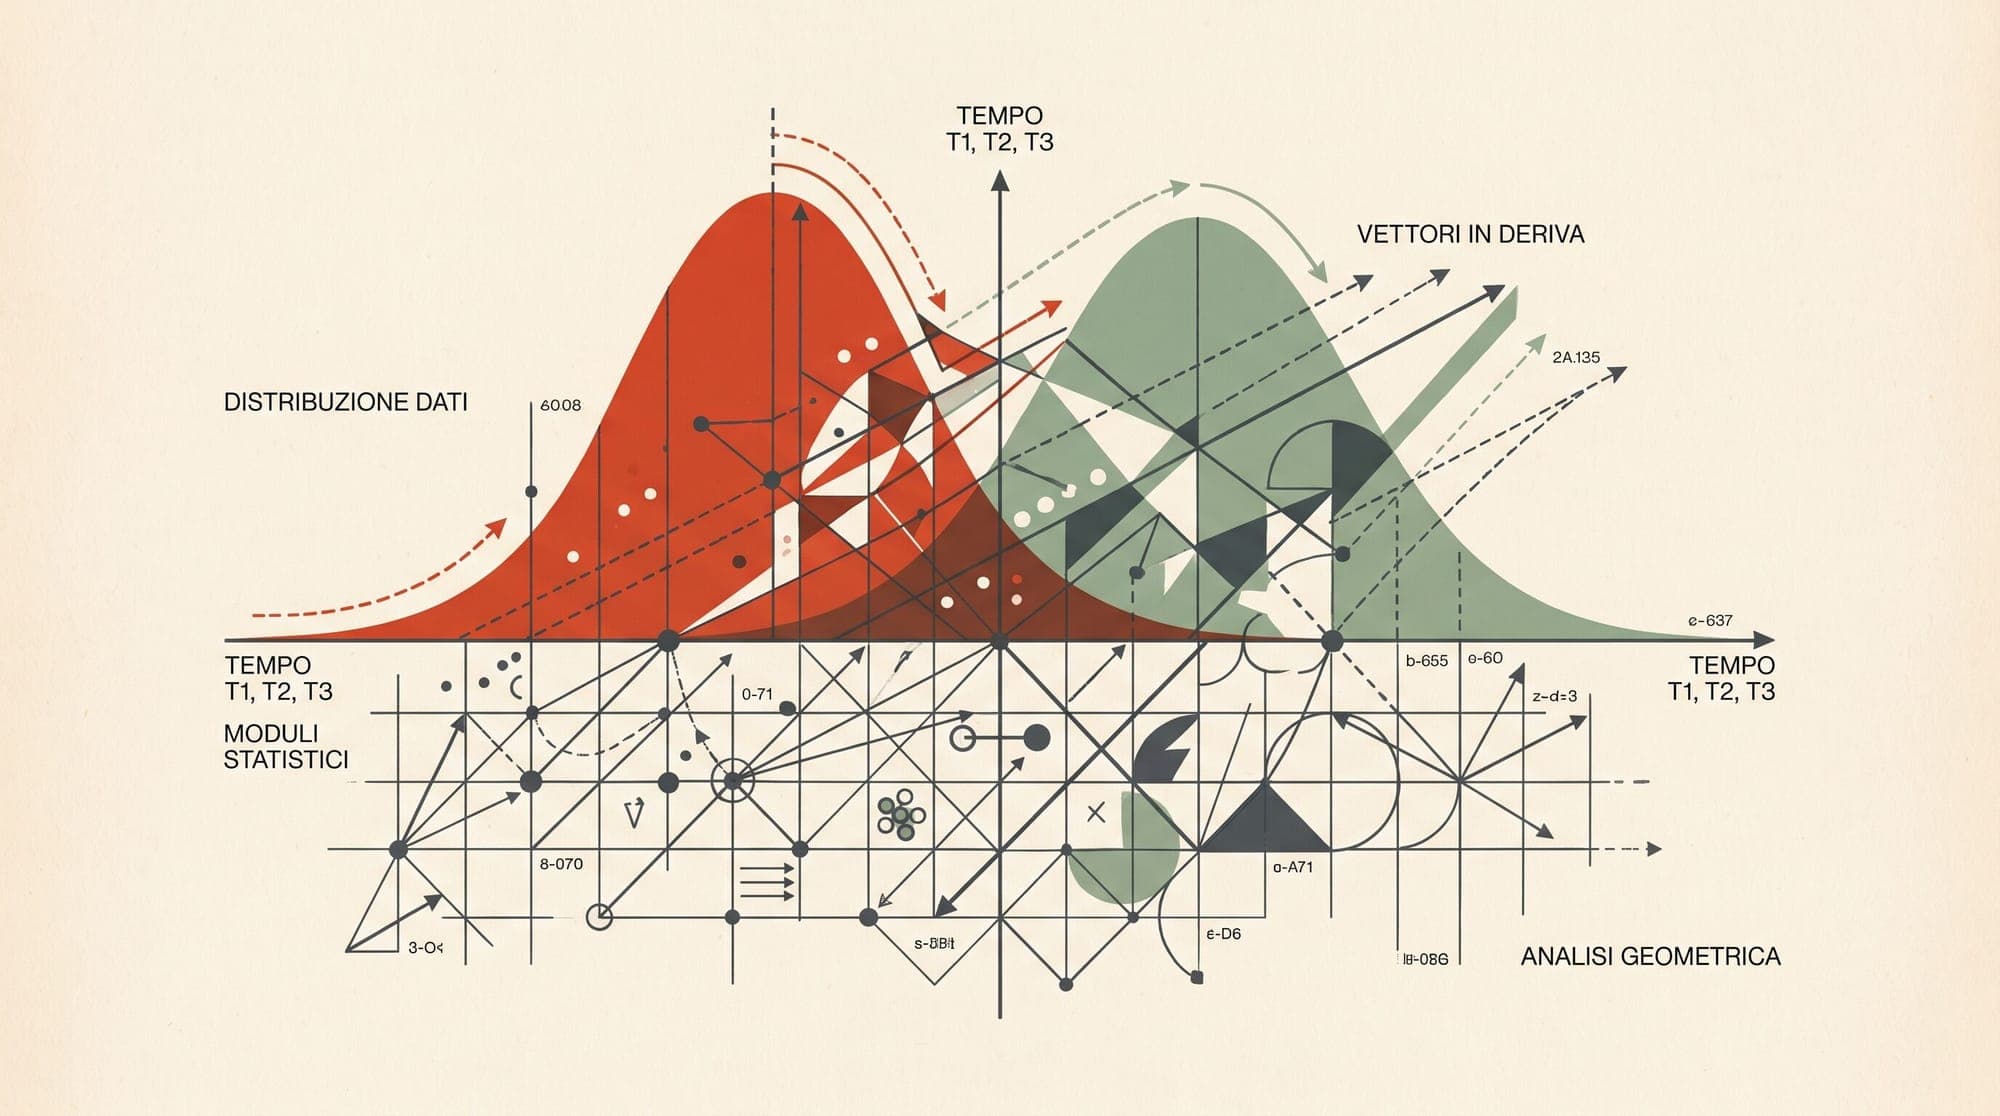
Semantic Drift and Data Distribution Monitoring in Production LLM Systems: Embedding Shift Detection, Output Entropy Tracking, and Quality Decay Metrics
Large language model applications rarely fail with loud runtime crashes once deployed. Instead, production systems suffer from silent performance decay caused by data distribution shifts. User queries evolve, real-world domain vocabularies change, retrieval corpora expand, and upstream model providers quietly alter model weights or system prompts. Without systematic monitoring of input embeddings, output token distributions, and retrieval alignment, production LLM systems degrade unnoticed until end users report inaccurate or hallucinated answers.
Detecting drift in unstructured text and high-dimensional vector spaces requires specialized statistical techniques that differ fundamentally from classical tabular monitoring. Production architectures must continuously quantify embedding shifts, track output entropy, and monitor tool-call divergence without imposing prohibitive compute overhead on real-time inference.
Taxonomy of Drift in Production LLM Architectures
Data distribution shifts in LLM systems manifest across four distinct architectural boundaries:
- Input Covariate Shift (Prompt Drift): The distribution of user queries changes over time while the underlying task remains constant. Examples include seasonal shifts in customer support intent, new slang or technical terminology, or a sudden influx of automated bot traffic.
- Concept and Domain Shift: The relationship between inputs and desired outputs changes because real-world facts or business policies have evolved. A prompt asking for current tax guidelines or pricing rules will produce incorrect answers if the system relies on outdated pre-training knowledge or static prompt templates.
- Retrieval Corpus Drift: In Retrieval-Augmented Generation (RAG) pipelines, the dense vector distribution of indexed documents shifts as new knowledge is ingested. When the semantic density of the vector index diverges from the query distribution, cosine similarity thresholds lose calibration, leading to irrelevant context retrieval.
- Model Output and Behavioral Drift: The statistical properties of generated tokens shift due to upstream API updates, temperature misconfigurations, or subtle context prompt mutations. Behavioral drift is characterized by changes in generation length, vocabulary diversity, refusal rates, and structured JSON validation errors.
Mathematical Drift Detection in Dense Embedding Spaces
Evaluating drift directly on raw text is computationally expensive and noisy. Modern production monitoring pipelines project input prompts and retrieved documents into dense embedding vectors via models such as text-embedding-3-small or open-weight bi-encoders like BGE and ModernBERT. Statistical distance metrics are then calculated between a baseline reference distribution (such as validation data or a 7-day rolling golden set) and a current sliding production window .
1. Maximum Mean Discrepancy (MMD)
Maximum Mean Discrepancy is a non-parametric kernel-based statistical test that determines whether two samples are drawn from different distributions without requiring density estimation. In Reproducing Kernel Hilbert Space (RKHS), the squared MMD between reference sample and production sample is calculated as:
Using a Gaussian Radial Basis Function (RBF) kernel , MMD captures both mean and higher-order moments of high-dimensional embedding distributions. An MMD score exceeding a permutation-tested critical threshold indicates statistically significant semantic drift.
2. Wasserstein Distance on Dimensionality-Reduced Projections
Computing the exact Earth Mover's Distance (Wasserstein-1) in high-dimensional vector spaces (such as 1536-dimensional embeddings) is computationally intractable for continuous streaming. Production systems apply Principal Component Analysis (PCA) or random orthogonal projections to compress embeddings into 5 to 10 principal components, then compute the 1D Wasserstein distance on each component:
where and are the cumulative distribution functions of the projected reference and production samples. A shift exceeding 0.1 standard deviations on top principal components signals a structural change in user intent.
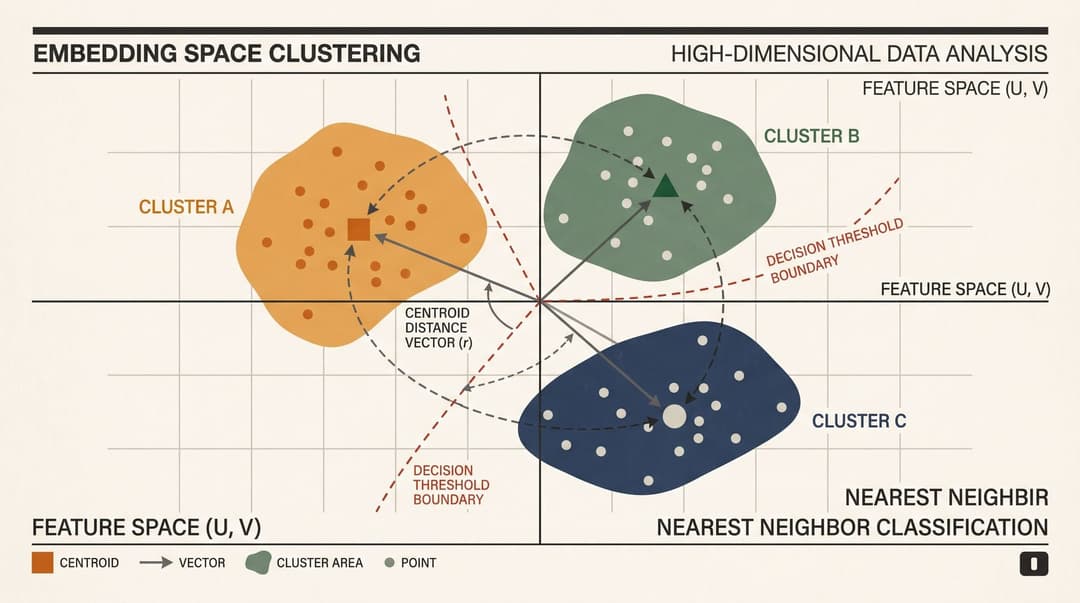
3. Centroid Distance and Vector Cosine Shift
For low-latency continuous alerting, tracking the distance between the empirical centroids and provides an metric. The cosine distance between centroids:
serves as a first-line canary metric. While centroid tracking fails to detect multi-modal dispersion shifts where the mean remains stationary, it reliably flags broad macro-shifts in domain topics.
4. Population Stability Index (PSI) on Vector Clusters
To monitor multi-modal clustering behavior, the reference embedding space is partitioned into discrete clusters via k-means. Production vectors are assigned to the nearest cluster centroid, and the Population Stability Index is computed across bucket proportions:
where and represent the fraction of vectors falling into cluster in the baseline and production batches. Standard production thresholds categorize as stable, as moderate shift requiring investigation, and as severe drift requiring automated mitigation.
5. Domain Classifier Discriminator (ROC-AUC)
An alternative approach trains a lightweight binary classifier (such as logistic regression or a shallow gradient-boosted tree) to distinguish between reference samples (labeled 0) and current production samples (labeled 1). If the classifier achieves an out-of-fold ROC-AUC close to 0.50, the distributions are indistinguishable. An ROC-AUC rising above 0.65 to 0.70 demonstrates that the classifier has learned distinct features separating the two datasets, confirming systematic distribution drift.
Output Distribution and Behavioral Monitoring
Monitoring inputs alone fails to catch model degradation caused by prompt regressions or subtle upstream model version updates. Production LLM monitoring stacks track output token dynamics, structural validity, and semantic stability.
Token-Level Shannon Entropy
When generation uncertainty increases, the model output distribution flattens. For models returning log probabilities (such as OpenAI, Anthropic, or self-hosted vLLM/SGLang instances), the average token entropy across a sequence of length is computed as:
where is the top- candidate token set. A sudden upward spike in rolling token entropy indicates that the model has encountered ambiguous or out-of-distribution prompts, while a sharp drop accompanied by repetitive phrasing indicates mode collapse.
Behavioral Metrics and Tool-Call Diagnostics
Production telemetry must log and aggregate the following operational signals:
- Token Length Skew: Sudden shifts in output token length distribution (measured via Kolmogorov-Smirnov test on generation lengths) often signal prompt formatting bugs or truncation errors.
- Refusal and Safety Trigger Rate: Monitoring the frequency of safety policy refusals and guardrail tripwires flags malicious prompt injection campaigns or overly aggressive system prompt filters.
- Structured Schema Validation Failures: For agentic systems relying on JSON tool calling, tracking Pydantic schema validation failures and retries per trajectory exposes signature incompatibilities and API contract regressions.
- Semantic Consistency and Self-BLEU: Periodically sampling stochastic generations for identical prompt clusters and measuring pairwise embedding similarity identifies rising hallucination rates.
Production System Architecture and Real-Time Pipeline Design
Implementing semantic drift monitoring without increasing inference latency requires decoupling evaluation from the synchronous request path.
[User Request] ──► [API Gateway] ──► [LLM Inference Engine] ──► [Response to User]
                         │                         │
                         ▼ (Async Log Stream)      ▼ (Async Log Stream)
              [Kafka / Kinesis Event Topic: Prompts & Responses]
                                       │
                                       ▼
                     [Stream Worker / Batch Evaluator]
              ├── Embedding Generation (or Matryoshka Truncation)
              ├── PCA / UMAP Projection & MMD Calculation
              ├── Token Entropy & Schema Validation Aggregation
              └── Cluster Assignment & PSI Calculation
                                       │
                                       ▼
                       [Metrics & Observability Store]
                        (Prometheus / OpenTelemetry /
                         Evidently / Arize / Langfuse)
                                       │
                                       ▼
                           [Alerting & Automation]
1. Asynchronous Ingestion via Event Streams
Inference servers emit prompts, generated responses, token logprobs, and retrieval metadata asynchronously to a messaging queue (such as Apache Kafka, AWS Kinesis, or Google Cloud Pub/Sub). The synchronous user-facing API remains unencumbered by monitoring computations.
2. Dimension Reduction and Subsampling
Computing MMD or full-rank distance metrics across hundreds of thousands of high-dimensional vectors every minute is cost-prohibitive. Production workers apply two optimizations:
- Matryoshka Truncation: Utilizing Matryoshka Representation Learning embeddings (such as OpenAI
text-embedding-3-smallor Nomic Embed), vectors are truncated from 1536 dimensions down to 256 or 128 dimensions before computing MMD, preserving over 95% of drift detection sensitivity while reducing memory and distance computation by 80% to 90%. - Reservoir Sampling: Sliding windows maintain a fixed-size reservoir sample (for example, 5,000 vectors per evaluation window) to provide deterministic memory bounds and predictable computational latency.
3. OpenTelemetry GenAI Semantic Conventions
Standardizing telemetry using OpenTelemetry GenAI semantic conventions ensures unified trace and metric schemas across heterogeneous model providers. Spans record gen_ai.request.model, gen_ai.usage.input_tokens, gen_ai.usage.output_tokens, gen_ai.response.finish_reasons, and custom attributes containing embedding cluster IDs and prompt entropy scores.
Automated Remediation and Closed-Loop Feedback
Drift detection is only valuable if it triggers concrete operational actions:
- Dynamic Model Escalation: When a sliding window detects severe input covariate shift () or high token entropy on lightweight models, the routing gateway dynamically escalates affected query classes to higher-capacity frontier models (such as GPT-4.5 or Claude 3.7 Sonnet).
- Automated Vector Store Re-Indexing: Retrieval drift alerts trigger automated ingestion pipelines to re-cluster knowledge base chunks, update BM25 sparse indexes, and re-tune hybrid search alpha weights.
- Active Learning and Exemplar Refresh: Out-of-distribution prompts identified by high MMD or unassigned k-means clusters are automatically routed to human-in-the-loop review queues. Verified responses are appended as few-shot exemplars to system prompt registries or used in subsequent fine-tuning datasets.
- Automated Alerting and Canary Rollbacks: If an updated system prompt or new fine-tuned model checkpoint causes output entropy or schema failure rates to exceed defined Service Level Objectives (SLOs), CI/CD pipelines automatically trigger a rollback to the previous stable baseline.
Summary
Maintaining reliable LLM applications at scale requires treating data distribution shift as an inevitable operational condition. By combining kernel-based embedding distance metrics (MMD), projected Wasserstein distances, cluster PSI tracking, and output token entropy monitoring, engineering teams can detect silent semantic decay before it impacts production users.
Sources
- Evidently AI: 5 Methods to Detect Drift in ML Embeddings
- Arize AI: Measuring Embedding Drift in Unstructured Text Data
- arXiv:2309.10000 - Detecting Covariate Drift in Text Data Using Document Embeddings and Dimensionality Reduction
- arXiv:2104.08663 - Dense Passage Retrieval and Embedding Representation Shifts
- OpenTelemetry: Semantic Conventions for Generative AI Operations
- Springer: Drift Detection in Text Data with Document Embeddings
