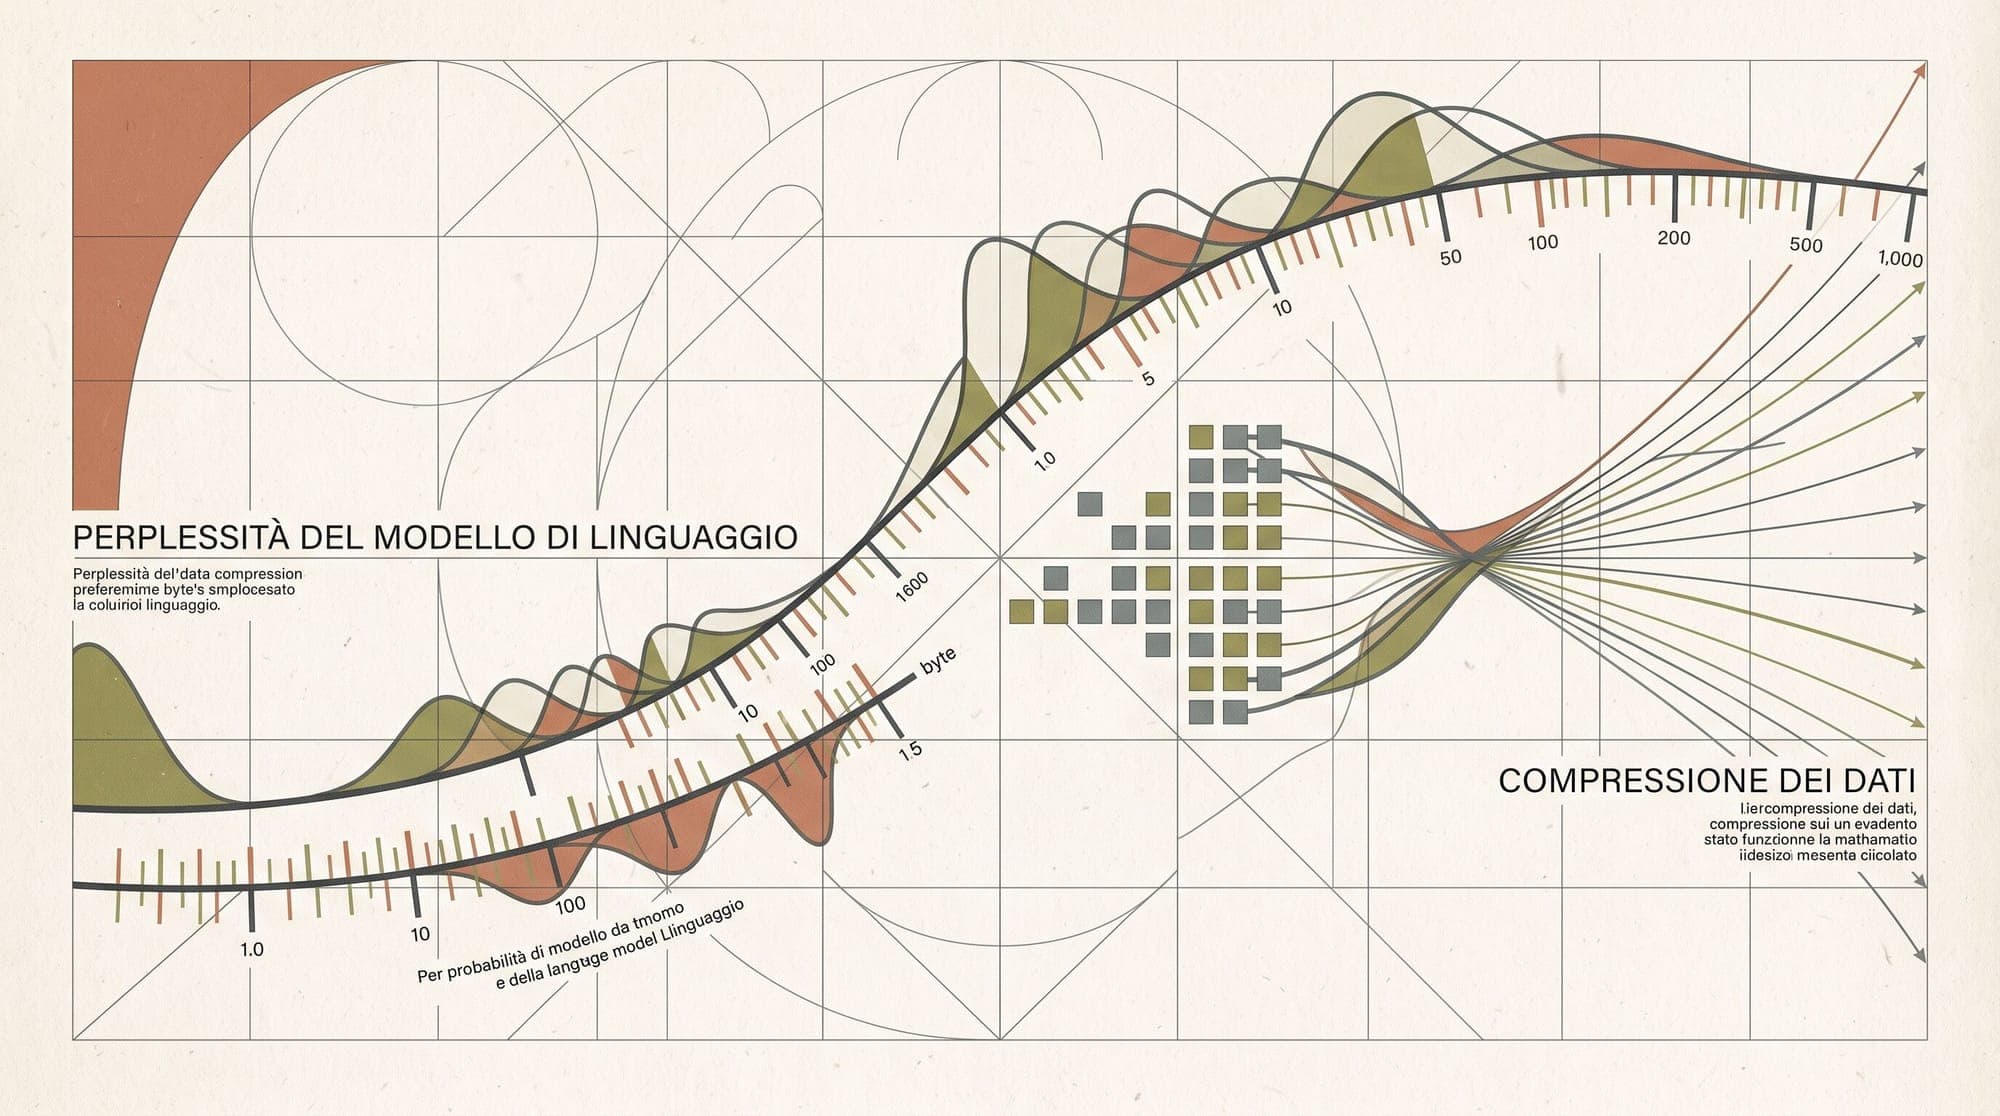
Perplexity and Bits-Per-Byte in Large Language Models: Mathematical Foundations, Tokenizer Dependency, and Compression Benchmarks
Evaluating autoregressive large language models requires metrics that quantify predictive confidence across text sequences. The standard objective during pre-training is the minimization of empirical risk under a cross-entropy loss function. Exponentiating this loss yields Perplexity (PPL), a foundational metric dating back to statistical speech recognition and n-gram language models (Jelinek et al., 1977).
Despite its ubiquity, raw token-level perplexity is frequently misunderstood and misapplied in comparative evaluations. Because token-level perplexity depends directly on the sequence segmentation produced by a model's tokenizer, raw perplexity scores across models with different vocabulary sizes (such as Llama 2's 32,000 tokens versus Llama 3's 128,000 tokens or Gemma's 256,000 tokens) are mathematically incomparable.
To establish an invariant benchmark across tokenizers and modalities, evaluation pipelines rely on Bits-Per-Byte (BPB) and Bits-Per-Character (BPC). Grounded in Shannon's source coding theorem, these metrics demonstrate that autoregressive language modeling is mathematically isomorphic to optimal lossless data compression (Delétang et al., 2024).

1. Mathematical Derivation: From Likelihood to Perplexity
An autoregressive language model computes the joint probability of a sequence of discrete tokens via the chain rule of probability:
where represents the preceding context tokens.
Negative Log-Likelihood and Cross-Entropy Loss
During training, the model parameters are optimized to minimize the negative log-likelihood (NLL) of the training corpus under base (measured in nats) or base 2 (measured in bits). Over a sequence of length , the mean cross-entropy loss is defined as:
When evaluated with base-2 logarithms, the loss reflects the average information content per token:
Derivation of Perplexity
Perplexity is formally defined as the exponential of the cross-entropy loss:
Using algebraic properties of exponentials and logarithms, this can be rewritten as the geometric mean of the inverse conditional probabilities:
Information-Theoretic Interpretation
Perplexity represents the effective branching factor of the model. A perplexity of indicates that, on average across the evaluation sequence, the model's uncertainty at each step is equivalent to selecting uniformly among equally probable candidate tokens from its vocabulary.
- Theoretical Minimum: . The model assigns probability to every ground-truth token with zero uncertainty.
- Uniform Random Guessing: , where is the total vocabulary size. If a model assigns equal probability to every token, , yielding .
2. The Tokenizer Dependency Problem
A widespread methodological error in LLM benchmarking is the direct comparison of token-level perplexity between models with different tokenizers.
The Mechanism of Tokenizer Distortion
Tokenizers partition raw text into subword units using algorithms like Byte-Pair Encoding (BPE) or WordPiece. The vocabulary size determines the average sequence compression ratio:
- Models with large vocabularies (e.g., Gemma with ) merge common multi-word phrases and syllables into single token IDs.
- Models with smaller vocabularies (e.g., Llama 2 with ) split the identical text into substantially more subword tokens.
Consider an evaluation sentence containing bytes:
- Tokenizer A () segments into tokens.
- Tokenizer B () segments into tokens.
Even if both models assign identical cumulative sequence probability to the total text, their per-token losses diverge:
If :
Model B exhibits a raw perplexity twice as high as Model A despite assigning the exact same likelihood to the underlying text string. Because Model B predicts larger chunks of text per step from a wider choice set, its per-step branching factor is higher, even though its overall modeling capability is equivalent or superior.

3. Bits-Per-Byte (BPB): The Invariant Standard
To eliminate tokenizer artifacts, language modeling loss must be normalized by an invariant physical unit: the total count of uncompressed UTF-8 bytes () or characters () in the evaluated text.
Mathematical Definition of BPB
Let a text corpus consist of raw bytes, which a tokenizer encodes into tokens. The total cross-entropy loss in bits across the sequence is:
Dividing by the total byte count yields Bits-Per-Byte (BPB):
Similarly, Bits-Per-Character (BPC) is defined over character length :
Cross-Model Comparison Across Tokenizer Families
Evaluating different vocabulary scales across standard English corpora (such as WikiText-103 or C4) demonstrates why BPB provides an objective comparison:
- GPT-2 (124M): Vocabulary 50,257 | ~3.70 bytes/token | Typical Token PPL ~16.5 | Computed BPB: ~1.09 BPB
- Llama 2 (7B): Vocabulary 32,000 | ~3.65 bytes/token | Typical Token PPL ~5.5 | Computed BPB: ~0.67 BPB
- Llama 3 (8B): Vocabulary 128,256 | ~4.25 bytes/token | Typical Token PPL ~7.8 | Computed BPB: ~0.59 BPB
- Gemma 2 (9B): Vocabulary 256,000 | ~4.60 bytes/token | Typical Token PPL ~10.2 | Computed BPB: ~0.57 BPB
- Qwen 2.5 (7B): Vocabulary 151,936 | ~4.30 bytes/token | Typical Token PPL ~8.1 | Computed BPB: ~0.58 BPB
While Llama 3 (8B) has a higher raw per-token perplexity (7.8) than Llama 2 (7B) (5.5), its BPB is significantly lower (0.59 vs 0.67 BPB), correctly identifying Llama 3 as the superior predictive model.
4. Language Modeling as Lossless Compression
The relationship between negative log-likelihood and information theory is formal: minimizing cross-entropy is identical to minimizing compressed bitstream length under arithmetic coding (Shannon, 1948).
The Shannon-Huffman Equivalence
According to Shannon's source coding theorem, the optimal code length for an event occurring with probability is:
Using Arithmetic Coding (Witten et al., 1987), a sequence of tokens can be compressed into a single floating-point interval whose length in bits approaches the theoretical entropy limit:
An autoregressive language model paired with an arithmetic coder functions as an exact, lossless compressor and decompressor:
- Compression: The sender initializes the model context, feeds each token, queries the next-token probability distribution , and emits arithmetic coding bits.
- Decompression: The receiver initializes the identical model weights, generates the exact same probability distribution, and uses the arithmetic coder to decode the deterministic token sequence.
DeepMind's Compression Benchmark
In a seminal 2024 study, Language Modeling Is Compression (Delétang et al., 2024), researchers at Google DeepMind evaluated pre-trained foundation models as general-purpose lossless data compressors across text, audio, and image datasets.
The findings demonstrated that foundation models trained on web corpora acquire generalizable compression capabilities across modalities:
- ImageNet Patches: Chinchilla 70B compressed raw image patches to 43.4% of their uncompressed byte size, outperforming domain-specific image compression standards such as PNG (58.5%).
- LibriSpeech Audio: Chinchilla 70B compressed raw audio waveforms to 16.4% of their uncompressed byte size, surpassing the specialized FLAC audio compressor (30.3%).
This empirical result validates Marcus Hutter's theoretical framework and the Hutter Prize (Hutter, 2006): compression performance serves as an objective, non-gameable benchmark for algorithmic intelligence.
5. Computational Methodology: Strided Sliding Window Evaluation
Computing perplexity over long documents presents subtle edge-case challenges related to context truncation and receptive fields.
The Truncation Pitfall (Non-Overlapping Chunks)
If a document exceeds the model's maximum sequence length , the naive approach splits text into independent segments of length :
In segment , the model must predict token with zero preceding context, even though the full document contains preceding text. This introduces severe cold-start penalties and artificially degrades the reported perplexity.
Strided Sliding Window Formulation
The standard evaluation protocol uses a strided sliding window (Hugging Face Transformers Documentation). The model context window slides forward by a fixed stride . At each step:
- The model receives a full context window of length .
- Loss is computed only on the newly introduced tail tokens of length .
- Preceding context tokens are masked in the loss computation using target masking (e.g., setting label targets to
-100).
Step 1: [Context: x_1 ... x_{L-S}] [Target: x_{L-S+1} ... x_L]     -> Loss computed on Target
Step 2: [Context: x_{S+1} ... x_L] [Target: x_{L+1} ... x_{L+S}]   -> Loss computed on Target
Reference Implementation
The following Python script implements strided evaluation using PyTorch and Hugging Face Transformers, calculating both token-level perplexity and normalized Bits-Per-Byte:
import torch
import math
from transformers import AutoModelForCausalLM, AutoTokenizer

def evaluate_perplexity_and_bpb(
    model_name: str,
    text: str,
    max_length: int = 4096,
    stride: int = 512,
    device: str = "cuda"
) -> dict:
    tokenizer = AutoTokenizer.from_pretrained(model_name)
    model = AutoModelForCausalLM.from_pretrained(
        model_name,
        torch_dtype=torch.float16,
        device_map=device
    )
    model.eval()

    # Encode input text to token IDs and calculate raw UTF-8 byte count
    encodings = tokenizer(text, return_tensors="pt")
    input_ids = encodings.input_ids.to(device)
    seq_len = input_ids.size(1)

    raw_bytes = len(text.encode("utf-8"))
    if raw_bytes == 0:
        raise ValueError("Evaluation text cannot be empty.")

    nlls = []
    total_eval_tokens = 0

    with torch.no_grad():
        for i in range(0, seq_len, stride):
            begin_loc = max(i + stride - max_length, 0)
            end_loc = min(i + stride, seq_len)
            trg_len = end_loc - i  # Number of newly evaluated target tokens

            chunk_input_ids = input_ids[:, begin_loc:end_loc]
            target_ids = chunk_input_ids.clone()

            # Mask context tokens so loss is only evaluated on target tokens
            target_ids[:, :-trg_len] = -100

            outputs = model(chunk_input_ids, labels=target_ids)

            # outputs.loss is the mean negative log-likelihood over unmasked tokens
            neg_log_likelihood = outputs.loss.item()

            # Total NLL for this target segment in nats
            nlls.append(neg_log_likelihood * trg_len)
            total_eval_tokens += trg_len

            if end_loc == seq_len:
                break

    total_nll_nats = sum(nlls)
    mean_nll_nats = total_nll_nats / total_eval_tokens

    # Standard token-level perplexity
    token_ppl = math.exp(mean_nll_nats)

    # Bits-per-token
    bits_per_token = mean_nll_nats / math.log(2)

    # Invariant Bits-per-Byte (BPB)
    total_loss_bits = total_nll_nats / math.log(2)
    bpb = total_loss_bits / raw_bytes

    return {
        "model": model_name,
        "total_tokens": total_eval_tokens,
        "total_bytes": raw_bytes,
        "token_perplexity": round(token_ppl, 4),
        "bits_per_token": round(bits_per_token, 4),
        "bits_per_byte": round(bpb, 4),
    }
6. Practical Limitations and Benchmark Decoupling
While perplexity and BPB are rigorous mathematical measures of density estimation, several practical nuances limit their direct correlation with downstream task performance:
1. Memorization vs. Generalization
A model can achieve exceptionally low perplexity on a test set by overfitting to stylistic markers, boilerplate, or leaked evaluation text without acquiring robust reasoning abilities. Deduplication algorithms (Lee et al., 2022) are necessary during pre-training to prevent memorization artifacts from artificially skewing evaluation.
2. Post-Training Alignment Trade-Offs
Supervised Fine-Tuning (SFT) and preference optimization (RLHF, DPO, GRPO) typically cause a modest increase in base validation perplexity (often 5% to 15%). Alignment constrains the generative output distribution to human-preferred responses, slightly reducing the model's likelihood on the broader distribution of all valid human text while dramatically boosting instruction-following performance on benchmarks like MMLU, GSM8K, and HumanEval.
3. Length Extrapolation Failures
When evaluating long contexts (e.g., 32K to 1M tokens), models without proper positional extrapolation mechanisms (such as YaRN, dynamic NTK scaling, or attention sinks) exhibit catastrophic perplexity explosion after exceeding their training context limit (Xiao et al., 2023). Tracking perplexity as a function of sequence position remains the primary tool for diagnosing attention collapse and context degradation.
7. Summary of Evaluation Metrics
When designing evaluation pipelines for foundation models and fine-tuned checkpoints:
- Use Token Perplexity strictly for tracking training loss curves and comparing checkpoints of the exact same model family and tokenizer.
- Use Bits-Per-Byte (BPB) when comparing models across different architectures, vocabulary sizes, or tokenizer configurations.
- Use Strided Sliding Windows () to eliminate cold-start truncation artifacts on long documents.
- Complement BPB with Downstream Evals (exact match, code pass@k, reasoning benchmarks) to measure functional capability alongside raw compression efficiency.
Sources
- Jelinek, F., et al. (1977). Perplexity: A measure of the difficulty of speech recognition tasks. IEEE Transactions on Acoustics, Speech, and Signal Processing.
- Shannon, C. E. (1948). A Mathematical Theory of Communication. Bell System Technical Journal.
- Delétang, G., Ruoss, A., Duquenne, P. A., et al. (2024). Language Modeling Is Compression. ICLR 2024 / arXiv:2309.10668.
- Witten, I. H., Neal, R. M., & Cleary, J. G. (1987). Arithmetic coding for data compression. Communications of the ACM.
- Hugging Face Documentation. (2023). Perplexity of Fixed-Length Models. Hugging Face Documentation.
- Hutter, M. (2006). The Hutter Prize for Lossless Compression of Human Knowledge. Hutter Prize.
- Xiao, G., Tian, Y., Chen, B., et al. (2023). Efficient Streaming Language Models with Attention Sinks. arXiv:2309.17453.
- Lee, K., Ippolito, D., Nystrom, A., et al. (2022). Deduplicating Training Data Makes Language Models Better. ACL 2022 / arXiv:2107.06499.