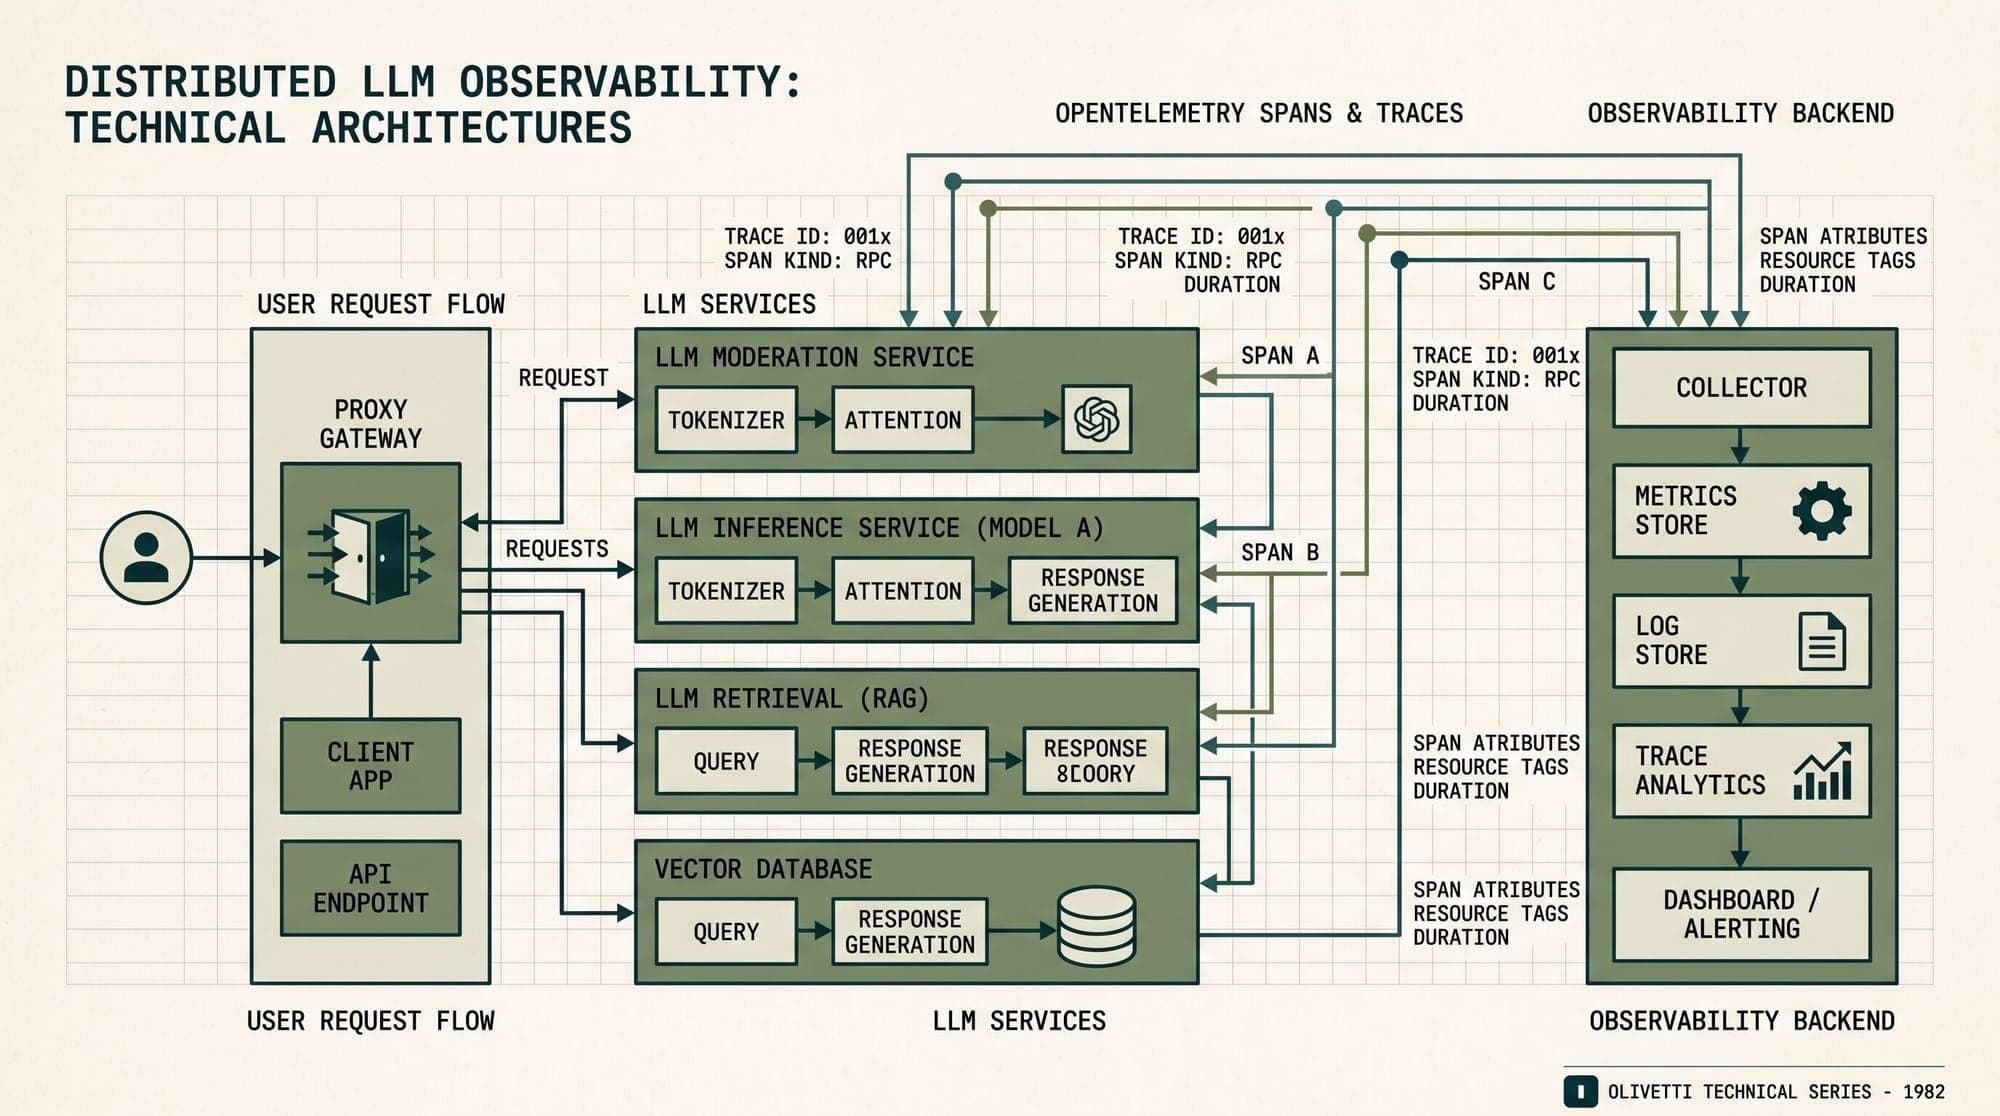
Tracing multi-step LLM pipelines, autonomous agent graphs, and retrieval-augmented generation (RAG) systems in production introduces telemetry challenges that traditional Application Performance Monitoring (APM) tools cannot address out of the box. While standard microservices rely on CPU utilization, HTTP status codes, and network latency percentiles, LLM workflows require deep inspection into non-deterministic text generation, nested execution graphs, prompt token counts, retrieved context relevance, and model drift.
Engineering teams scaling LLM workloads face four distinct observability architectures: hybrid application-level platforms like Langfuse, ML-native open standards engines like Arize Phoenix, zero-infrastructure APM auto-instrumentors like Traceloop OpenLLMetry, and edge-proxy interceptors like Helicone.
Each paradigm enforces distinct trade-offs across data privacy, ingestion latency, schema standardization, operational complexity, and total cost of ownership.

Core Architectural Paradigms
Production LLM observability systems collect and process runtime telemetry across three distinct topologies: in-process SDK instrumentation, edge proxy routing, and vendor-neutral OpenTelemetry collector pipelines.
1. Langfuse: Application-Level Tracing and Product Lifecycle Management
Langfuse operates as an open-source, full-lifecycle LLM engineering platform designed for application developers. Its architecture relies on a hybrid persistence model:
- Relational Storage (PostgreSQL): Manages relational metadata, user authentication, Role-Based Access Control (RBAC), prompt versioning, dataset registries, and human review annotations.
- Columnar Analytics (ClickHouse): Stores immutable trace logs, span events, generation inputs/outputs, and token consumption metrics to support fast analytical aggregation across millions of requests.
- Ingestion Layer: Accepts telemetry through native Python/TypeScript SDKs, framework integrations (LangChain, LlamaIndex), or via standard OpenTelemetry (OTLP) endpoints.
Langfuse bridges the gap between raw execution traces and product development. In addition to latency and cost tracking, it integrates prompt management with release tagging, playground experimentation, and automated online evaluations where background workers asynchronously score production traces using LLM-as-a-judge criteria.
2. Arize Phoenix: OpenInference and ML-Centric Evaluation
Arize Phoenix focuses on deep evaluation, embedding space analysis, and ML diagnostic rigor. Phoenix is built entirely around OpenTelemetry and the OpenInference Semantic Conventions:
- OpenInference Standardization: Instead of proprietary span structures, Phoenix defines explicit attributes such as
openinference.span.kind(categorizing spans intoLLM,CHAIN,RETRIEVER,TOOL,AGENT, orEMBEDDING), ensuring traces remain portable across open-source tooling. - High-Dimensional Visualization: Includes built-in UMAP dimensionality reduction to project query and document embeddings into 2D/3D visual clusters, enabling teams to spot retrieval drift and query clustering.
- Evaluation Framework: Ships specialized evaluation primitives for the RAG triad: context relevance, groundedness (faithfulness), and answer relevance.
Phoenix runs either as a lightweight in-process server for local notebook experimentation or as a containerized service backed by DuckDB/PostgreSQL for production clusters, connecting directly into the broader Arize enterprise observability ecosystem.
3. OpenLLMetry (Traceloop): Infrastructure-Less APM Federation
Maintained by Traceloop, OpenLLMetry rejects the concept of running a dedicated, isolated dashboard for LLM metrics. Instead, it treats LLM calls as standard distributed microservice spans:
- Auto-Instrumentation: Operates as a set of OpenTelemetry Python and TypeScript auto-instrumentation modules that monkey-patch standard LLM SDKs (OpenAI, Anthropic, Cohere, Bedrock), vector databases (Pinecone, Qdrant, Chroma, Weaviate), and orchestration libraries.
- OTLP Direct Export: Emits standard OpenTelemetry traces directly to existing enterprise APM backends, such as Datadog, Grafana Tempo, Honeycomb, Dynatrace, or New Relic via an OpenTelemetry Collector.
- Zero Additional Infrastructure: Organizations that already operate enterprise monitoring infrastructure avoid maintaining separate databases, web dashboards, and access permissions for AI engineers.
4. Helicone: Edge-Proxy Logging and Gateway Control
Helicone approaches observability through the network layer by positioning a reverse proxy between the client application and downstream LLM API providers:
- Edge Infrastructure: Built on Cloudflare Workers deployed globally across hundreds of edge points of presence, adding less than 25ms to 50ms of p95 routing latency.
- Asynchronous Queue Pipeline: The edge worker streams request metadata and payload references into a distributed Apache Kafka buffer, which is consumed by backend workers and persisted into ClickHouse for analytics and MinIO/S3 for raw payload storage.
- Zero-Code Integration: Onboarding requires modifying only the
baseURLparameter in standard OpenAI or Anthropic client configurations, passing authentication and routing flags via custom HTTP headers. - Gateway Capabilities: Because it intercepts the network transport, Helicone provides native edge caching (exact-match and semantic), fallback provider routing, rate limiting, and real-time budget enforcement.
Telemetry Schemas: OpenTelemetry GenAI vs. OpenInference
A primary architectural consideration in production tracing is the semantic specification used to serialize nested execution graphs.
The OpenTelemetry community defines standard GenAI attributes under the gen_ai.* namespace (e.g., gen_ai.request.model, gen_ai.usage.input_tokens, gen_ai.response.finish_reasons). These conventions focus primarily on single-call request/response boundaries and token accounting.
In contrast, the OpenInference specification is tailored for complex agentic graphs and RAG pipelines. It enforces structured serialization for:
- Message Sequences:
llm.input_messages.0.message.roleandllm.input_messages.0.message.contentpreserving structured multi-turn dialogue state. - Retrieval Payloads:
retrieval.documents.0.document.id,retrieval.documents.0.document.score, andretrieval.documents.0.document.contentfor document ranking verification. - Tool Calling Invocations:
tool.name,tool.parameters, andtool.outputlinking function arguments directly to subsequent LLM input spans.
While Phoenix consumes OpenInference natively and Langfuse provides translation layers for OTLP ingestion, systems routing to generic APMs via OpenLLMetry map these attributes into standard distributed tracing spans.
Ingestion Mechanics and Latency Overhead
Observability instrumentation must not degrade user-facing Time to First Token (TTFT) or streaming generation throughput.
In-Process SDK Hooks (Langfuse, Phoenix, OpenLLMetry)
In-process SDKs hook into model client methods. When handling streaming responses (Server-Sent Events), SDKs wrap the response generator:
- Each streamed token chunk is yielded directly to the caller with zero blocking overhead.
- Concurrently, an in-memory buffer accumulates chunk deltas in a background thread or async task.
- Upon stream completion, the span calculates total token usage, captures the full completion text, and queues the payload into a batching exporter.
- Telemetry batches flush asynchronously over HTTP/gRPC to the collector, isolating user response latency from backend ingestion delays.
Edge Proxy Interception (Helicone)
Because proxy architectures sit directly in the transport stream:
- Requests traverse an additional network hop to the nearest edge PoP before routing to the provider endpoint.
- The proxy pipes the downstream SSE byte stream back to the client while tapping the stream in flight.
- Completed response bodies are pushed asynchronously to Kafka or S3 workers without holding the client connection open.
- Proxy approaches eliminate client-side CPU overhead but introduce deterministic geographic network transit latency.
Production Evaluation Pipelines
Collecting traces represents only half of the observability requirement; validating output quality in production requires automated evaluation pipelines.
Online LLM-as-a-Judge
Modern production stacks trigger asynchronous evaluations on a sampled percentage of live traffic:
- Sampling Strategies: High-throughput production services apply deterministic hashing on session IDs (e.g., evaluating 5% of total requests) to control LLM evaluation token costs while maintaining statistical significance.
- Evaluator Execution: Dedicated background workers consume completed trace IDs from queues, fetch full execution spans (system prompt, retrieved documents, model output), and submit structured evaluation prompts to cost-effective evaluator models.
- Scoring Metrics: Evaluators output binary flags or scalar ratings covering hallucination detection, prompt injection attempts, tone consistency, and tool selection accuracy.
Human-in-the-Loop Annotation and Golden Datasets
Platforms like Langfuse and Phoenix incorporate human annotation queues. When an automated evaluator flags a low confidence score or a user submits negative feedback (such as a thumbs-down event logged via SDK), the corresponding trace is routed to a triage queue. Domain experts review the execution graph, correct the output, and export the resolved trace directly into regression test datasets used in pre-deployment CI/CD quality gates.
Architectural Trade-Offs and System Comparison
Selecting the right observability foundation depends on existing infrastructure, data residency constraints, and operational capacity:
- Langfuse: Best suited for product engineering teams requiring an end-to-end open-source platform combining production tracing, prompt management, dataset curation, and flexible self-hosting via Docker/Kubernetes (PostgreSQL + ClickHouse).
- Arize Phoenix: Best suited for ML teams, data scientists, and RAG practitioners requiring strict adherence to OpenInference standards, advanced embedding space drift analysis, and deep evaluation metrics without vendor lock-in.
- OpenLLMetry (Traceloop): Best suited for enterprise infrastructure teams with established observability investments (Datadog, Grafana Tempo, Honeycomb) who want vendor-neutral OpenTelemetry auto-instrumentation without deploying or maintaining a separate LLM dashboard stack.
- Helicone: Best suited for teams seeking instant, zero-code onboarding, edge-based rate limiting, cost control, and semantic caching via proxy routing without embedding complex SDK hooks into application runtimes.
Sources
- OpenInference Semantic Conventions Specification
- Arize Phoenix OpenInference Semantic Conventions Documentation
- Langfuse Architecture and Self-Hosting Documentation
- Traceloop OpenLLMetry Architecture and Instrumentations
- LLM Observability with Datadog and OpenLLMetry
- LLM Observability with Grafana Tempo and OpenLLMetry
- Helicone Distributed Self-Hosting Architecture
- Scaling LLM Observability with Cloudflare Workers and Kafka - Upstash & Helicone