LLM Observability and Tracing in Production: Comparing Langfuse, Arize Phoenix, LangSmith, and OpenLLMetry
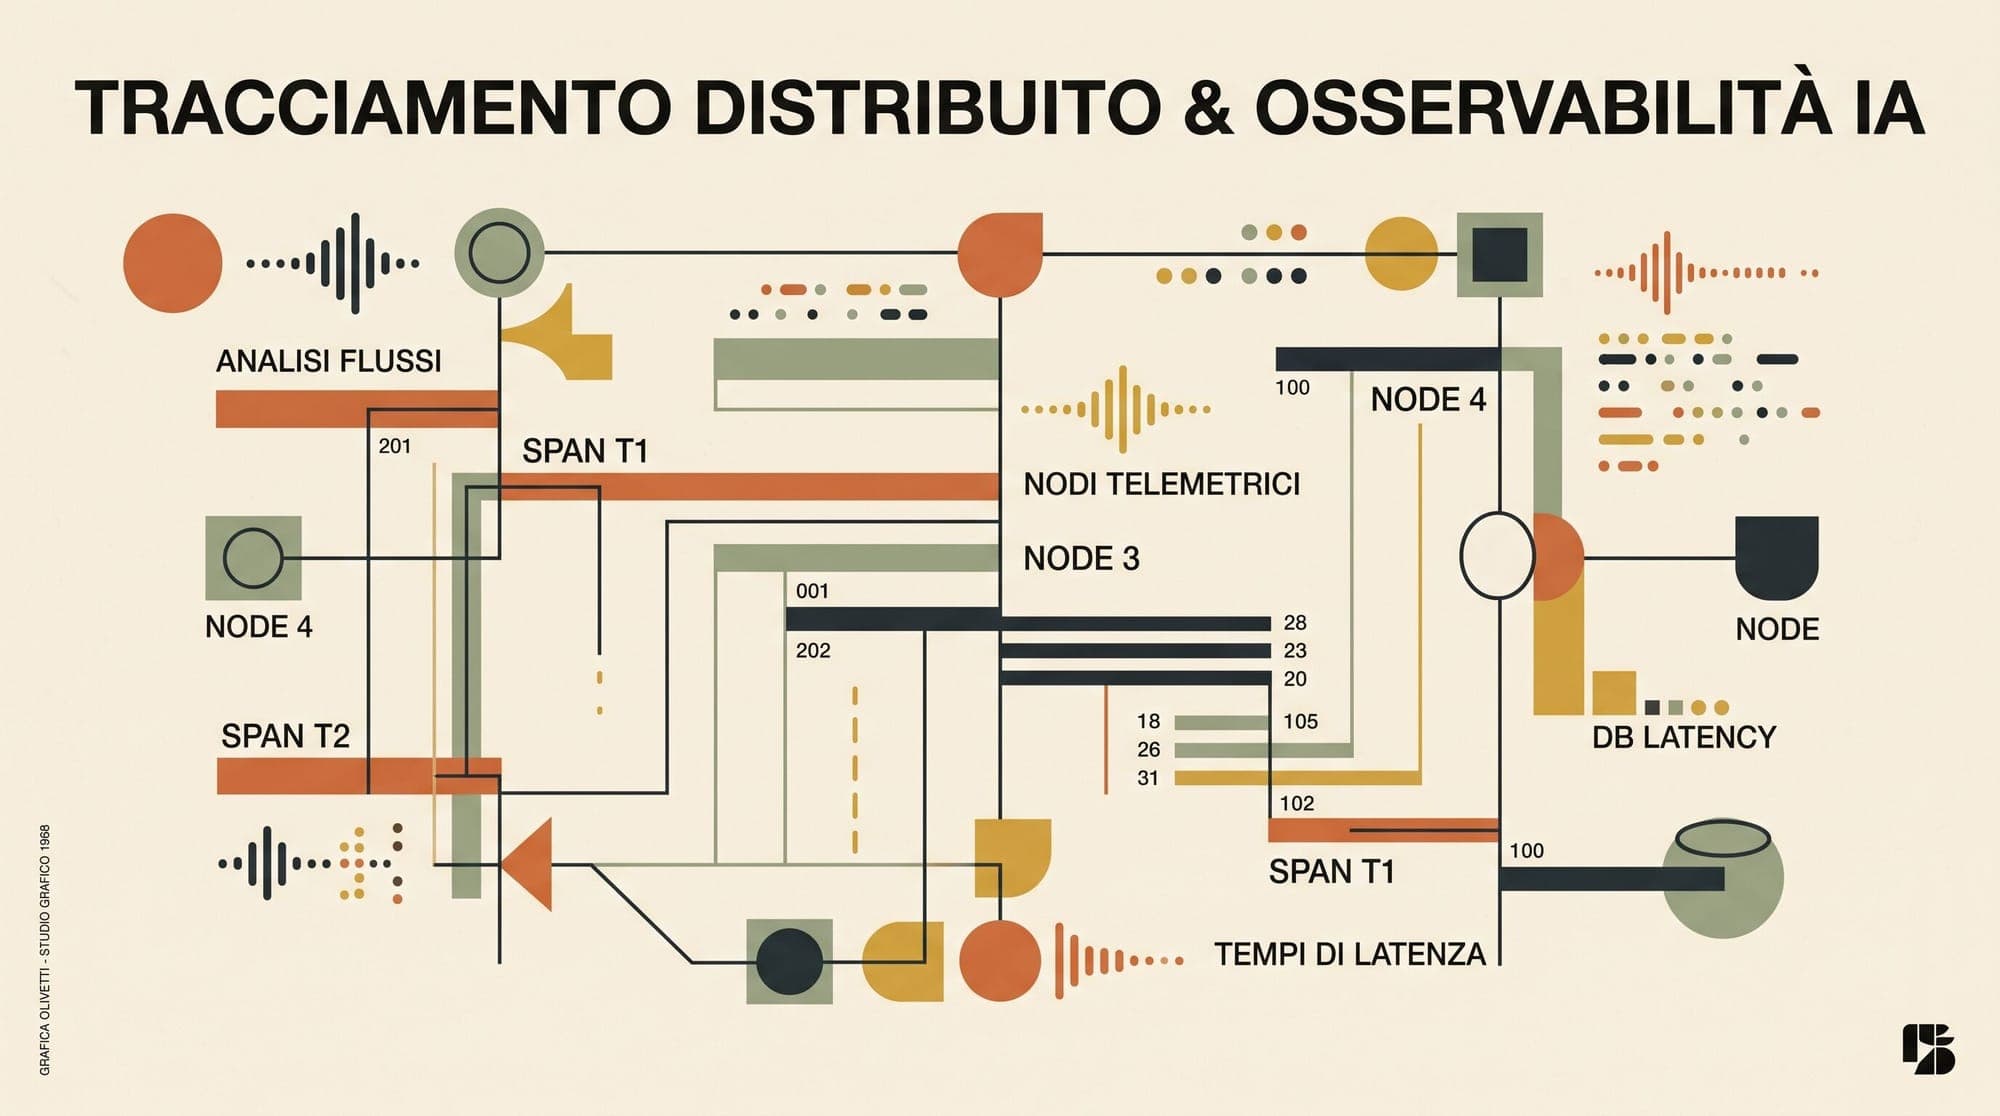
Moving language models from single-turn prompt wrappers into multi-agent architectures, recursive Retrieval-Augmented Generation (RAG) graphs, and autonomous tool-calling loops fundamentally changes system dynamics. LLM applications behave as distributed state machines where failure modes are rarely deterministic. Latency spikes can stem from vector store indexing bottlenecks, context window bloat, or slow token generation, while quality degradations emerge through subtle prompt drift, context contamination, and compounding tool errors.
Traditional Application Performance Monitoring (APM) tools designed for microservices track HTTP request durations, database connection pools, and server CPU loads. They fail to capture token economics, prompt template versions, model hallucination scores, vector similarity metrics, or hierarchical agent execution graphs. To operate LLM systems reliably at scale, engineering teams rely on dedicated LLM observability platforms.
Selecting the right observability stack requires navigating trade-offs across instrumentation protocols, storage architectures, evaluation workflows, and infrastructure hosting models.

The Three Instrumentation and Ingestion Paradigms
Production LLM observability systems collect and ingest telemetry through three distinct architectural approaches:
1. In-Process SDK and OpenTelemetry Auto-Instrumentation
In-process instrumentation wraps standard model SDKs (such as OpenAI, Anthropic, or Mistral) and orchestration libraries (such as LangChain, LlamaIndex, or AutoGen). Calls are recorded as hierarchical spans (Trace -> Span -> Event) and dispatched asynchronously via background worker threads using OpenTelemetry (OTel) Protocol (OTLP) exporters.
- Advantages: Zero network latency added to the critical inference path; captures full execution context including intermediate Python data transformations, local vector search operations, and tool arguments.
- Trade-offs: Requires library imports or SDK monkey-patching within application code; crashes or worker backpressure can lead to dropped telemetry if queues fill.
2. Reverse Proxy and API Gateway Logging
Proxy-based architectures place an HTTP reverse proxy in front of external LLM API endpoints. The application directs API calls to the gateway, which logs request/response payloads, token counts, and latency before forwarding traffic to model providers.
- Advantages: Completely non-invasive setup requiring only environment variable changes (
OPENAI_BASE_URL); enables centralized API key rotation, rate limiting, and fallback routing across providers. - Trade-offs: Adds an additional network hop to every API request; visibility is strictly limited to model API boundary calls, missing internal vector database queries, prompt formatting logic, and agent state transitions.
3. OpenTelemetry Semantic Conventions (OpenInference vs OTel GenAI)
Telemetry standardization has coalesced around OpenTelemetry semantic conventions. Two prominent specifications define span naming, attributes, and hierarchy for generative AI:
- OpenTelemetry GenAI Semantic Conventions: Maintained by the core OpenTelemetry specification body, standardizing attributes such as
gen_ai.system,gen_ai.request.model,gen_ai.request.temperature,gen_ai.usage.input_tokens, andgen_ai.usage.output_tokens. - OpenInference: An open standard spearheaded by Arize AI and widely supported across frameworks, extending OTel with specialized span kinds for agents, retrievers, tools, and rerankers (
openinference.span.kind = RETRIEVER | AGENT | TOOL | LLM).
Platform-by-Platform Architectural Breakdown
Langfuse: Dual-Database Architecture for Scalable Open-Source Observability
Langfuse provides an open-source (MIT licensed) and cloud-hosted LLM engineering platform built specifically for high-throughput tracing, prompt versioning, and evaluation workflows.
Architectural Core: PostgreSQL and ClickHouse Separation
In early iterations, Langfuse operated entirely on PostgreSQL. As production users scaled into hundreds of millions of spans, relational tables encountered heavy I/O saturation during concurrent trace writes and analytical aggregations. In Langfuse v3, the platform separated transactional and analytical concerns into a dual-engine storage topology:
- PostgreSQL: Stores transactional relational entities requiring strict ACID guarantees, including user management, organization access control, prompt templates, evaluation configurations, and API keys.
- ClickHouse: An open-source columnar OLAP database that ingests high-volume trace streams, observation spans, and evaluation scores. ClickHouse delivers sub-second analytical aggregations across billions of logged tokens and latency percentiles.
- Async Workers & Redis: Ingestion endpoints enqueue incoming OTLP batches into Redis/Valkey queues (managed via BullMQ), which dedicated worker services drain into ClickHouse and Amazon S3 blob storage for large multi-modal attachments.
Operational Profile
- Strengths: Robust self-hosting story via Docker Compose and Kubernetes Helm charts; full OpenTelemetry compliance (native Python v4 and TypeScript v5 SDKs); integrated prompt management and LLM-as-a-judge dataset pipelines.
- Trade-offs: Self-hosting the complete v3 stack introduces operational overhead (managing PostgreSQL, ClickHouse, Redis, worker containers, and S3-compatible storage); native alerting is minimal compared to legacy APMs, requiring metric forwarding to Grafana or Datadog.
- Best Fit: Engineering teams wanting open-source data sovereignty with high-scale analytical query capabilities and native OpenTelemetry integration.
Arize Phoenix: OpenInference Standard and RAG Diagnostics
Arize Phoenix is an open-source AI observability platform developed by Arize AI, centered around tracing, evaluation benchmarking, and diagnostic exploration of retrieval systems.
Architectural Core: OpenInference and Embedding Space Exploration
Phoenix serves as the reference implementation for the OpenInference semantic convention. Its engine connects directly to local runtimes, notebook environments, and distributed clusters:
- Zero-Friction In-Memory & DuckDB Storage: Phoenix can launch directly inside Python runtime processes (
px.launch()) backed by local DuckDB instances for interactive debugging, or run as a standalone container connected to PostgreSQL. - Embedding & UMAP Dimensionality Reduction: Beyond standard latency and token metrics, Phoenix analyzes high-dimensional vector embeddings, clustering user queries, context chunks, and failure points in 3D vector space to detect retrieval drift and semantic clusters.
- Evals and Benchmark Engines: Built-in evaluation harnesses support context relevance, ground truth precision, faithfulness, and hallucination metrics with continuous evaluation pipelines.
Operational Profile
- Strengths: Leading visual diagnostics for RAG retrieval debugging; champion of the vendor-neutral OpenInference ecosystem; simple one-line setup for local experimentation and CI/CD eval testing.
- Trade-offs: Standalone open-source instances lack the multi-tenant role-based access control and high-throughput ClickHouse scaling found in Arize's enterprise cloud tier (Arize AX).
- Best Fit: Teams heavily focused on RAG quality, vector retrieval diagnostics, and pre-production/post-production evaluation benchmarks.
LangSmith: Deep Agent Debugging and Managed Enterprise Governance
LangSmith is the native commercial observability and testing platform built by LangChain, designed for fine-grained debugging of complex graph-based agents and chains.
Architectural Core: RunTree Streaming and Graph Step Inspection
LangSmith is engineered around the execution model of LangChain and LangGraph, though it also ingests generic traces via OTLP endpoints and standalone Python/JS SDKs:
- Hierarchical Graph Traversal: Visualizes cyclic agent loops, conditional branching, tool call arguments, human-in-the-loop pause states, and checkpointed thread memories directly in the UI.
- Playground and Dataset Forking: Allows developers to take any failing production trace span, open it directly in a prompt sandbox, edit system instructions or few-shot examples, test against alternative models, and export test cases into regression suites.
- High-Throughput Managed Ingestion: Operates a globally distributed managed backend capable of streaming token-by-token execution traces without dropping payload fidelity.
Operational Profile
- Strengths: Unmatched visualization and debugging for LangGraph state machines; frictionless setup for LangChain users via environment variables (
LANGCHAIN_TRACING_V2=true); rich dataset annotation and human evaluation workflows. - Trade-offs: Proprietary SaaS-first model; self-hosted enterprise deployment is limited to complex private VPC installations; costs scale linearly with trace volume ($0.005 per trace on standard paid tiers), which can become substantial at high scale without aggressive sampling.
- Best Fit: Organizations with deep investments in LangGraph or LangChain seeking a fully managed, turn-key agent debugging and evaluation environment.
OpenLLMetry (Traceloop): Pure OpenTelemetry and Vendor Neutrality
OpenLLMetry is an open-source suite of OpenTelemetry-based auto-instrumentation packages created by Traceloop.
Architectural Core: Universal Instrumentation Without Backend Lock-In
Unlike Langfuse, Phoenix, or LangSmith, OpenLLMetry does not seek to be a standalone storage or UI destination. Instead, it functions purely as the standard instrumentation layer:
- Standard OTLP Exporter Pipeline: OpenLLMetry automatically patches standard Python and TypeScript libraries (including OpenAI, Anthropic, Bedrock, Cohere, Pinecone, Chroma, Qdrant, Milvus, and Weaviate), converting internal calls into OpenTelemetry-compliant spans.
- Universal Destination Target: Emitted traces can route simultaneously to any standard APM or LLM backend: Datadog, Honeycomb, New Relic, Dynatrace, SigNoz, Grafana Tempo, Arize Phoenix, or Langfuse.
- Span Normalization Processors: Includes span processors that dynamically translate between OpenTelemetry GenAI semantic conventions and OpenInference attributes, ensuring broad backend compatibility.
Operational Profile
- Strengths: Zero vendor lock-in; reuses existing enterprise OpenTelemetry collector infrastructure; supports polyglot environments with minimal maintenance footprint.
- Trade-offs: Provides no built-in UI, evaluation dashboard, or prompt management repository on its own; relies entirely on the downstream visualization backend.
- Best Fit: Enterprises with established observability infrastructure (Datadog, Honeycomb, Grafana) wanting to integrate LLM metrics into unified system dashboards without standing up dedicated AI databases.
Production Evaluation and Platform Comparison
To select the appropriate framework, engineering teams should evaluate four primary operational dimensions:
1. Storage Backend and Scalability
- Langfuse: Dual storage (PostgreSQL for transactional metadata, ClickHouse for high-volume analytical spans). Handles billions of records with sub-second aggregate query speeds.
- Arize Phoenix: In-memory / DuckDB for local exploration; PostgreSQL / Arize AX cloud for production persistence.
- LangSmith: Managed multi-tenant cloud storage with high-throughput streaming architecture; dedicated VPC deployments for enterprise contracts.
- OpenLLMetry: Backend-agnostic; inherits the scaling characteristics of the target OTLP collector (e.g., ClickHouse in SigNoz, ClickHouse in Langfuse, or cloud APMs).
2. Instrumentation Standards
- Langfuse: OpenTelemetry native SDKs and standard OTLP ingestion endpoint.
- Arize Phoenix: OpenInference specification and OTLP ingestion.
- LangSmith: Native RunTree SDK with secondary OTLP endpoint support.
- OpenLLMetry: Pure OpenTelemetry auto-instrumentation for 25+ AI libraries and vector databases.
3. Core Functional Strengths
- Langfuse: Open-source data sovereignty, cost tracking, prompt management, and high-volume analytical queries.
- Arize Phoenix: RAG evaluation metrics, embedding drift detection, UMAP clustering, and interactive notebook diagnostics.
- LangSmith: Complex agentic graph debugging, interactive trace-to-playground iteration, and LangGraph lifecycle state inspection.
- OpenLLMetry: Universal vendor neutrality, enterprise APM unification, and zero standalone infrastructure footprint.
4. Hosting and Licensing Model
- Langfuse: MIT Open-Source (Self-hosted via Docker/K8s) and Managed Cloud.
- Arize Phoenix: Apache 2.0 Open-Source (Local/Container) and Arize AX Enterprise Cloud.
- LangSmith: Proprietary Managed SaaS and Enterprise Private Cloud.
- OpenLLMetry: Apache 2.0 Open-Source SDK with Traceloop Managed Cloud option.
Production Implementation Strategies
When instrumenting LLM architectures in production environments, teams should apply three operational patterns:
- Head-Based and Tail-Based Sampling: High-volume consumer LLM pipelines should avoid 100% trace ingestion for routine low-risk calls. Implement tail-based sampling at the collector level to retain 100% of error traces, high-latency outliers (p95/p99), and flagged user feedback while sampling uniform successful completions at 5-10%.
- PII and Sensitive Data Masking: Token-level traces capture raw prompts and completions. Use OpenTelemetry span processors to scrub regex-matched credit card numbers, email addresses, and internal authentication tokens before spans exit the local VPC.
- Decoupled Asynchronous Exporting: Always configure non-blocking batch span processors (
BatchSpanProcessor) with bounded in-memory ring buffers to guarantee that network hiccups between application pods and observability backends never introduce latency to user-facing inference streams.
Sources
- Langfuse v3 Infrastructure Evolution and ClickHouse Architecture
- Langfuse System Architecture and Storage Engine Design
- ClickHouse Welcomes Langfuse: Open-Source LLM Observability
- Arize Phoenix: Open-Source AI Observability and Evaluation Engine
- OpenLLMetry and Traceloop OpenTelemetry Integration Guide
- OpenLLMetry Auto-Instrumentation Suite on GitHub
- LangSmith Documentation and Tracing Architecture
- OpenTelemetry Semantic Conventions for Generative AI