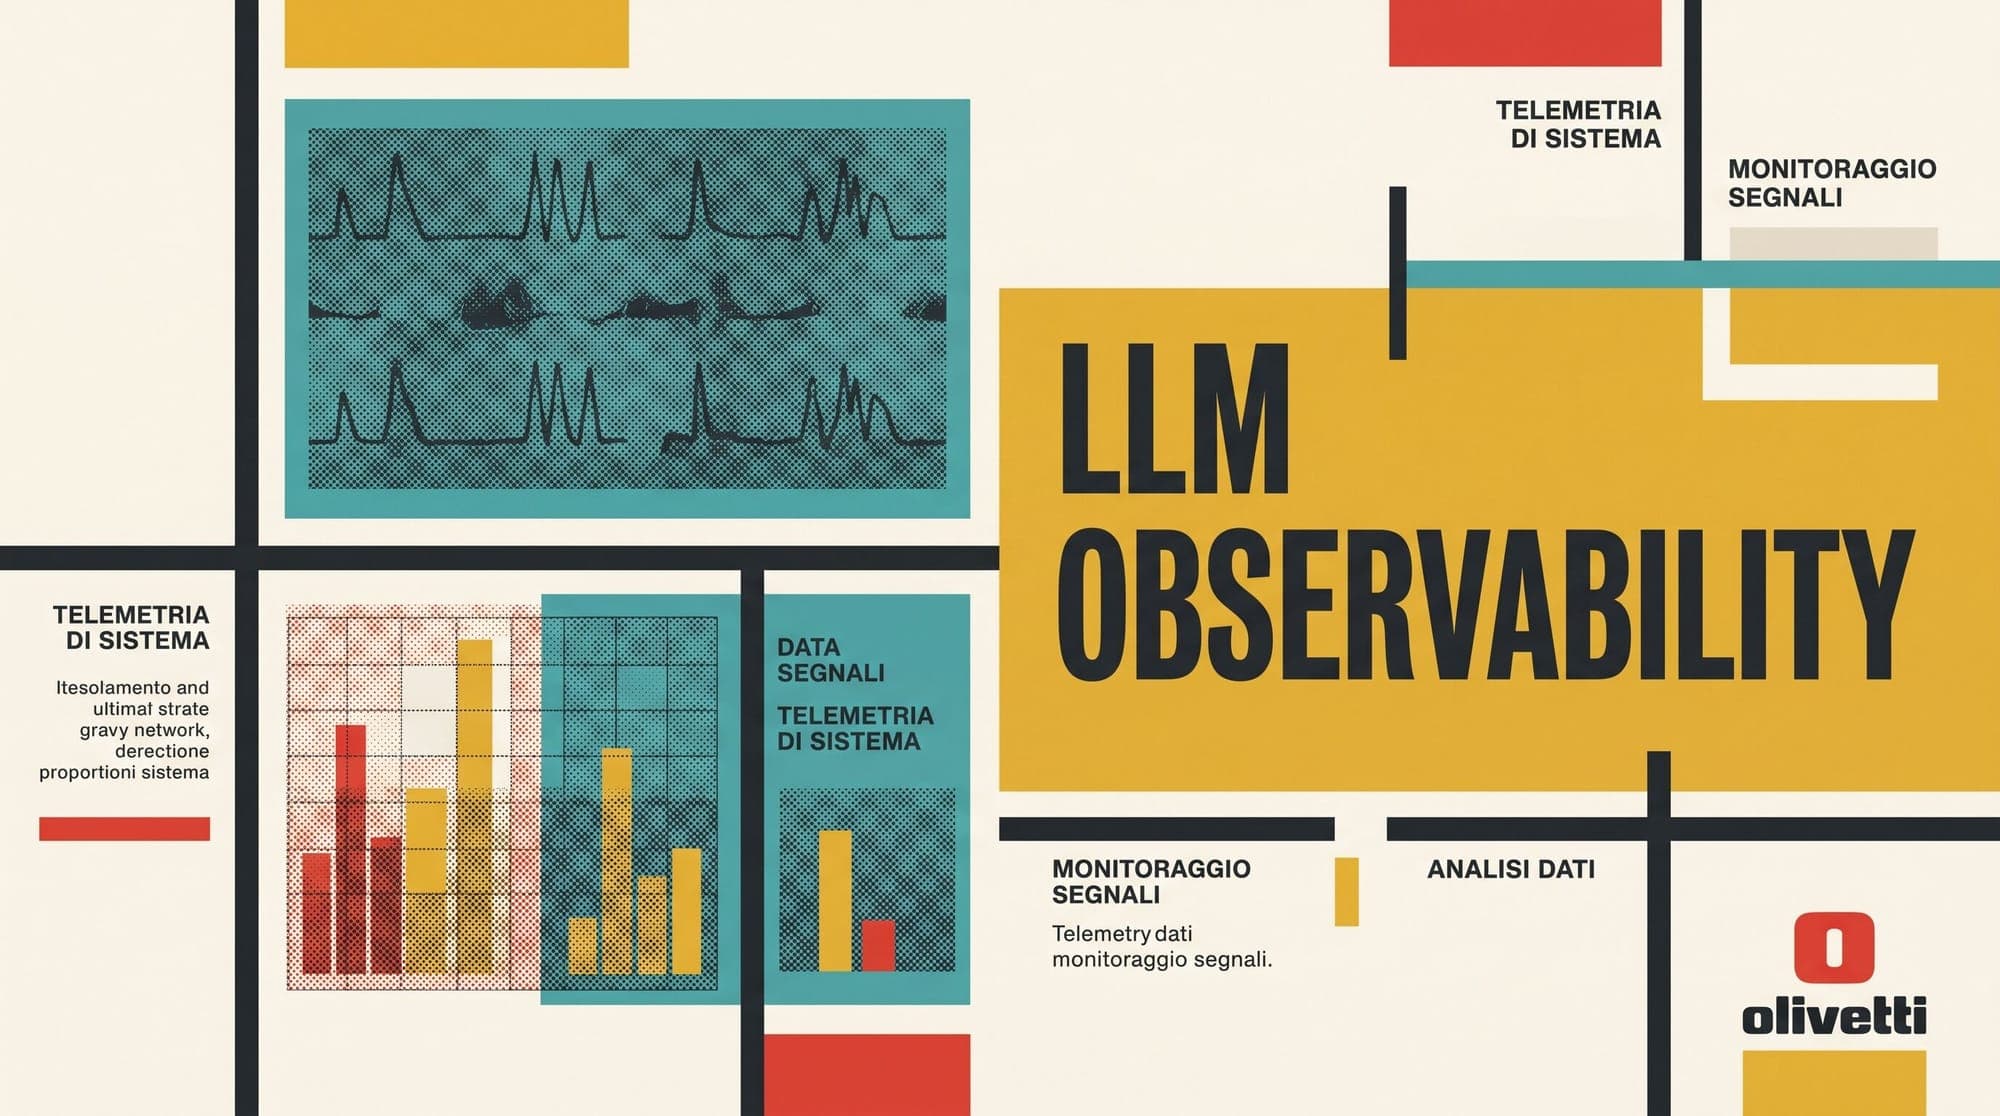
LLM Observability in Production: OpenTelemetry Semantic Conventions, Distributed Tracing, and Latency Profiling
Deploying large language models into production introduces failure modes that traditional application performance monitoring (APM) tools were never designed to diagnose. Standard web services fail with discrete HTTP error codes, predictable database timeouts, or memory leaks. In contrast, LLM applications fail through silent semantic drift, hallucinated tool parameters, unbounded prompt bloat, cascading multi-agent retry loops, and erratic token-generation latencies.
Monitoring these distributed systems requires transitioning from basic log aggregation to structured distributed tracing. The Cloud Native Computing Foundation (CNCF) and the OpenTelemetry project have established formal OpenTelemetry Semantic Conventions for Generative AI to standardize how spans, metrics, and events are collected across inference providers, vector databases, and agent frameworks.
Implementing production-grade LLM observability requires understanding semantic span hierarchies, streaming latency profiling, tool invocation instrumentation, cost attribution, and payload privacy governance.
The Limitations of Traditional APM for Generative AI
Traditional APM tooling treats external API calls as opaque HTTP request-response boundaries. For a standard REST service, recording the status code, duration, and endpoint URL provides sufficient operational insight. For generative AI pipelines, this black-box approach obscures critical system behaviors:
- Non-Deterministic Execution Paths: A single user query can trigger recursive retrieval-augmented generation (RAG) loops, dynamic query expansion, multiple tool executions, and fallback model routing. Flat HTTP request metrics fail to convey the causal graph of execution.
- Decoupled Latency Dimensions: A 4-second LLM response cannot be evaluated as a single duration. It consists of gateway queue time, prompt prefill processing, Time to First Token (TTFT), and per-token autoregressive generation speed (Inter-Token Latency).
- Variable Unit Economics: Unlike static compute instances, LLM operational costs fluctuate per request based on exact input and output token consumption, dynamic cache hits, and speculative decoding verification rates.
- Semantic Degradation: A request can return HTTP 200 while outputting malformed JSON, infinite repetitive loops, or truncated responses due to improperly configured
max_tokenslimits.
To address these challenges, modern architectures capture nested execution graphs where every vector search, reranking pass, prompt template formatting, model invocation, and tool call exists as a discrete child span within a distributed trace.
OpenTelemetry GenAI Semantic Conventions
The OpenTelemetry GenAI Semantic Conventions define standardized attribute keys under the gen_ai. namespace. Adhering to these conventions ensures that telemetry ingested from Python, TypeScript, Go, or proxy gateways maps to identical schema definitions across storage engines and dashboards.
Core Span Attributes
Every LLM inference span is classified by operation type and enriched with foundational metadata:
gen_ai.system: The provider or backend family handling the request (for example,openai,anthropic,vertex_ai,vllm,bedrock).gen_ai.operation.name: The operational primitive being executed. Standardized operations includechat,text_completion,embeddings, andexecute_tool.gen_ai.request.model: The specific model requested by the client application (for example,gpt-4o,claude-3-5-sonnet-20241022).gen_ai.response.model: The exact model instance that served the completion, capturing automated backend fallbacks or versioned routing targets.gen_ai.request.temperature,gen_ai.request.top_p,gen_ai.request.max_tokens: Sampling hyperparameters governing generation stochasticity.gen_ai.response.finish_reasons: An array of stop conditions returned by the engine (such asstop,length,content_filter,tool_calls).
Standardized Usage Metrics
Token usage attributes enable real-time tracking of operational spend and context utilization:
gen_ai.usage.input_tokens: The count of tokens in the prompt payload, including system instructions, retrieved context, and conversation history.gen_ai.usage.output_tokens: The count of tokens generated in the completion response.gen_ai.usage.cache_read_input_tokens: Tokens served directly from prompt KV caches, enabling verification of prompt caching efficiency.gen_ai.usage.cache_creation_input_tokens: Tokens written to cache stores for subsequent reuse.
According to the OpenTelemetry Metrics Specification, these attributes are paired with synchronous and asynchronous instruments such as gen_ai.client.token.usage (histogram) and gen_ai.client.operation.duration (duration histogram).
Profiling Streaming Inference: TTFT vs ITL
For interactive chat and copilot applications, measuring total end-to-end latency fails to reflect actual user-perceived responsiveness. Production observability platforms decompose streaming inference into two distinct metrics:
Time to First Token (TTFT)
TTFT measures the elapsed duration from when the client initiates the request until the server yields the first generated output token. TTFT encapsulates:
- Client-to-server network transport and gateway routing.
- Context prefill computation (processing input prompt tokens through attention layers).
- KV cache loading and potential queuing delays on congested inference clusters.
High TTFT indicates either network congestion, large unprocessed context windows without prompt caching, or overloaded inference hardware queues.
Inter-Token Latency (ITL) and Output Throughput
Once the first token is emitted, the model enters autoregressive generation mode. Inter-Token Latency (ITL), also measured as Time Per Output Token (TPOT), reflects the millisecond duration between consecutive emitted tokens.
Instrumenting streaming spans requires hooking into the client stream iterator without introducing processing latency into the application event loop:
import time
from opentelemetry import trace

tracer = trace.get_tracer("llm.inference")

def stream_llm_response(prompt: str, model: str):
    start_time = time.perf_counter()
    first_token_time = None
    output_tokens = []

    with tracer.start_as_current_span("gen_ai.chat") as span:
        span.set_attribute("gen_ai.system", "anthropic")
        span.set_attribute("gen_ai.operation.name", "chat")
        span.set_attribute("gen_ai.request.model", model)

        # Invoke streaming client
        stream = client.messages.create(
            model=model,
            max_tokens=1024,
            messages=[{"role": "user", "content": prompt}],
            stream=True,
        )

        for chunk in stream:
            if chunk.type == "content_block_delta":
                if first_token_time is None:
                    first_token_time = time.perf_counter()
                    ttft = first_token_time - start_time
                    span.set_attribute("gen_ai.client.token.time_to_first_token", ttft)

                output_tokens.append(chunk.delta.text)
                yield chunk.delta.text

        total_duration = time.perf_counter() - start_time
        span.set_attribute("gen_ai.usage.output_tokens", len(output_tokens))
        span.set_attribute("gen_ai.client.operation.duration", total_duration)
Instrumenting RAG Pipelines and Multi-Agent Workflows

Modern AI architectures involve multi-step pipelines where LLM inference is only one component of a broader workflow. Semantic tracing extensions like Arize OpenInference and Envoy AI Gateway define standardized span categories for agentic operations:
1. Vector Retrieval and Reranking Spans
A RAG trace encapsulates vector index lookups, keyword searches, and cross-encoder reranking. Spans record:
openinference.span.kind:retrieverretrieval.query: The transformed search query.retrieval.top_k: The requested number of candidate documents.retrieval.documents: Document identifiers, chunk metadata, similarity scores, and rerank scores.
This allows engineers to determine whether a failure resulted from poor retrieval quality (low similarity scores) or poor LLM reasoning (accurate context provided, but hallucinated response).
2. Tool and Function Execution Spans
Agentic systems execute external tools to retrieve real-time state or mutate external databases. Tool spans record:
openinference.span.kind:tooltool.name: Identifier of the invoked function (for example,search_database,calculate_tax).tool.parameters: Input JSON schema arguments passed by the model.tool.output: Execution result or formatted exception string.
Tracing tool calls reveals parameter hallucination rates, tool timeout bottlenecks, and recursive error cascades where agents repeatedly execute failing tools.
[Trace: User Query: "Summarize Q3 Financials"]
 ├── [Span: Agent Workflow (kind=agent)]
 │    ├── [Span: Query Rewriter (kind=chain)]
 │    │    └── [Span: LLM Chat (model=claude-3-5-haiku)]
 │    ├── [Span: Vector Index Search (kind=retriever, top_k=10)]
 │    ├── [Span: Cross-Encoder Reranker (top_k=3)]
 │    ├── [Span: Tool Call: fetch_sec_filing (kind=tool)]
 │    └── [Span: LLM Synthesis (model=claude-3-5-sonnet, tokens=1420)]
Data Governance, PII Masking, and Cost Attribution
Logging full prompt and response payloads into observability backends introduces significant compliance, cost, and security risks.
Privacy and PII Redaction
In healthcare, finance, and enterprise SaaS, raw prompts frequently contain Personally Identifiable Information (PII), Protected Health Information (PHI), or proprietary credentials. Telemetry pipelines must implement sanitization layers before spans leave application boundaries:
- Client-Side Redaction: Running regex engines or local Named Entity Recognition (NER) models (such as Microsoft Presidio) to mask email addresses, API tokens, credit card numbers, and social security identifiers before spans are serialized.
- Opt-In Content Events: OpenTelemetry GenAI conventions isolate prompt and completion bodies into explicit log events rather than mandatory span attributes, allowing infrastructure teams to disable payload capture in production environments while retaining token metrics and latency traces.
Real-Time Cost Attribution
Token usage metrics must be paired with dynamic pricing engines to calculate unit economics per customer, tenant, feature, or engineering team. By attaching business metadata (tenant.id, user.plan_tier, feature.name) as span attributes, stream processors can compute financial burn rates in real time:
Correlating dollar costs directly with trace identifiers enables automated throttling of malicious or runaway recursive agent loops before they deplete API budgets.
Production Deployment: Collector Topology and Sampling
Exporting high-dimensional telemetry from high-throughput inference endpoints requires careful infrastructure design to avoid introducing application overhead:
- Asynchronous Non-Blocking Export: Spans must be dispatched via asynchronous batch processors using gRPC or OTLP/HTTP. Telemetry serialization must never block the inference response pathway.
- Head vs. Tail-Based Sampling: Simple head-based sampling (e.g., recording 5% of all requests at creation time) frequently drops rare failure modes like 500 server errors, tool timeouts, or anomalous latency spikes. Production clusters deploy OpenTelemetry Collectors configured with Tail-Based Sampling, retaining:
- 100% of traces containing HTTP/gRPC errors or tool execution exceptions.
- 100% of traces where TTFT or total latency exceeds the 95th percentile threshold.
- A deterministic 1% to 5% sample of normal, low-latency executions for baseline metrics.
- Local Collector Daemons: Running an OpenTelemetry Collector instance locally (as a Kubernetes DaemonSet or sidecar) allows application nodes to offload compression, PII filtering, and remote export over local Unix domain sockets.
Standardizing on OpenTelemetry GenAI semantic conventions ensures organizations maintain full operational visibility across multi-vendor LLM deployments without risking proprietary vendor lock-in.
Sources
- OpenTelemetry Semantic Conventions for Generative AI
- OpenTelemetry GenAI Observability Specification
- OpenTelemetry Metrics Semantic Conventions
- Arize AI: The Role of OpenTelemetry in LLM Observability
- Envoy AI Gateway: OpenInference Tracing Architecture
- Cloud Native Computing Foundation: OpenTelemetry Specification