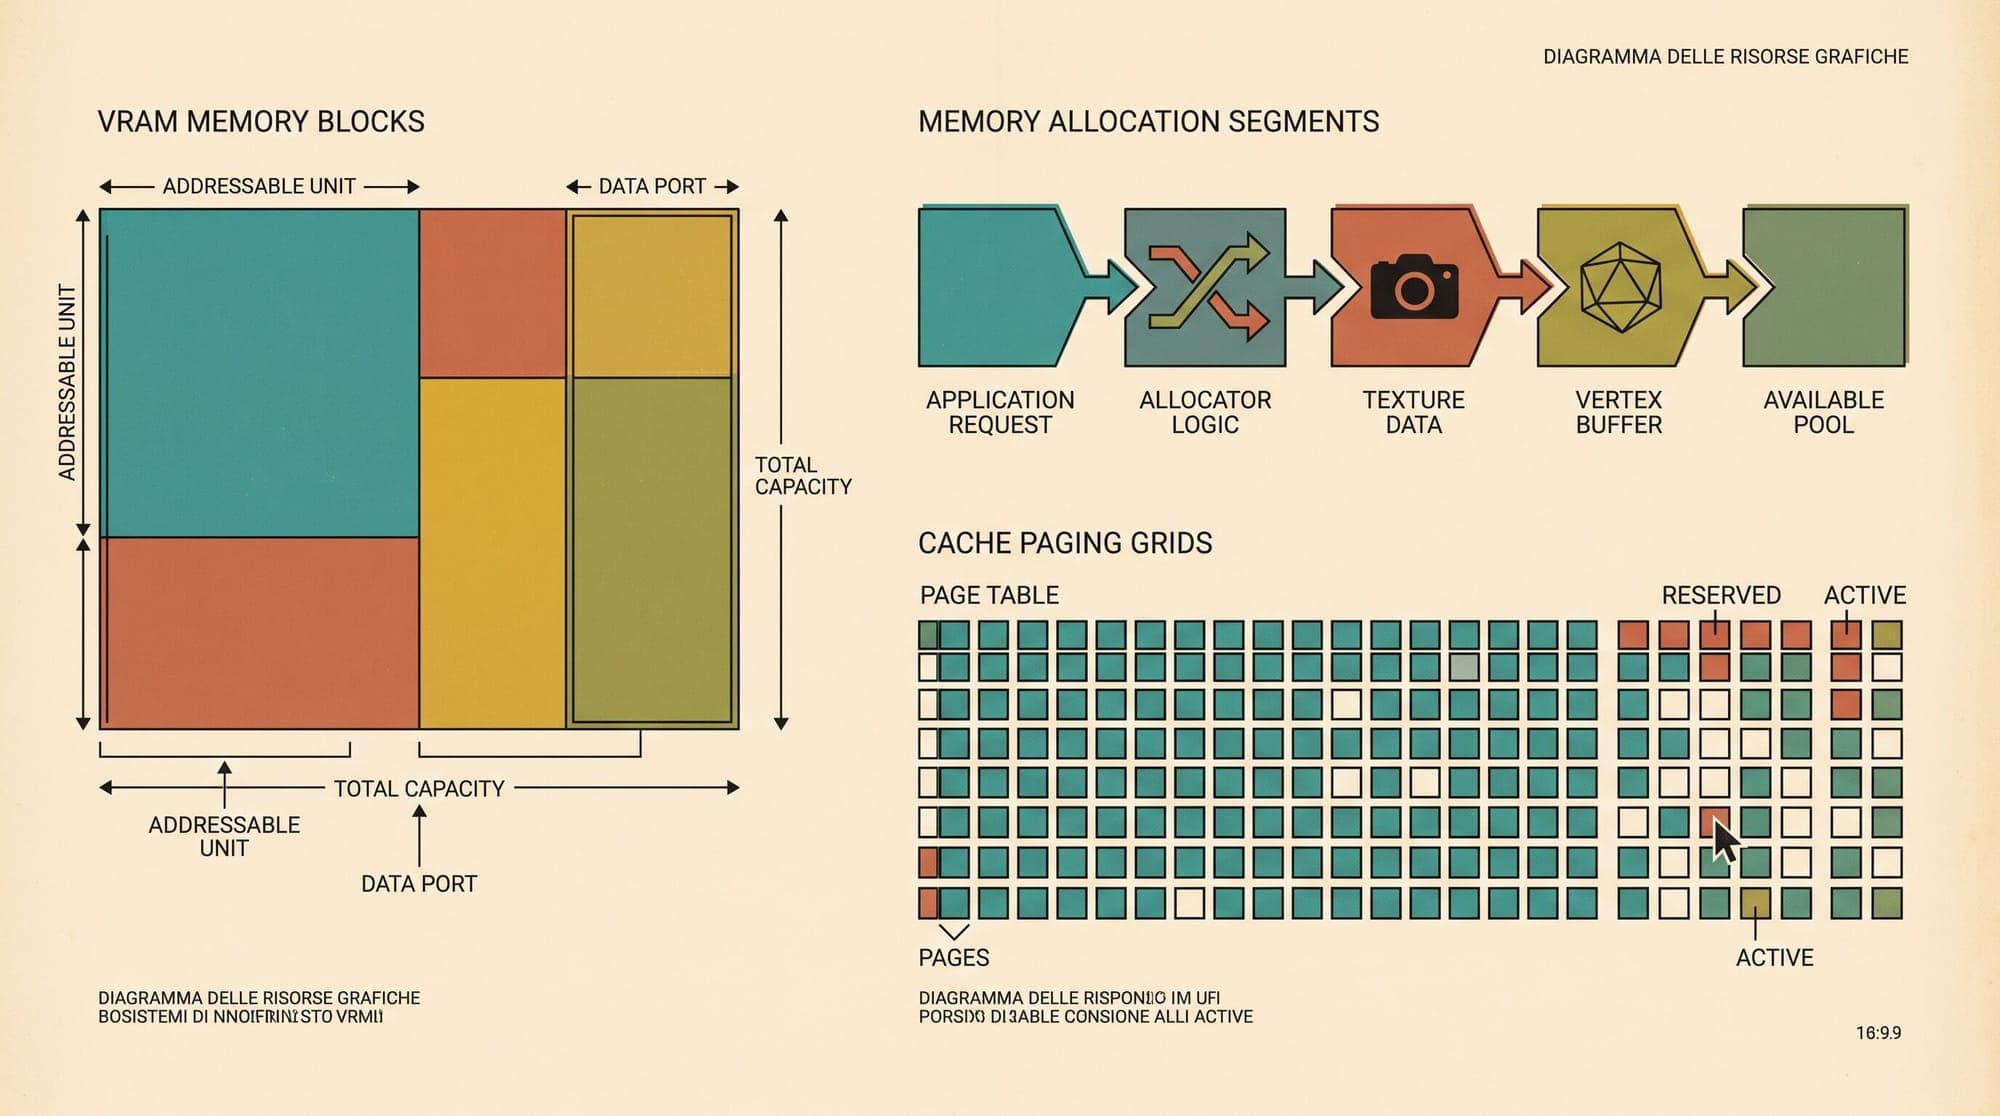
In high-throughput large language model serving, memory is the primary constraint governing latency, batch concurrency, and context length. While model parameter footprints are static and easily calculated, runtime GPU memory (VRAM) dynamics are governed by low-level caching allocators, dynamic key-value (KV) cache allocation pools, transient activation spikes, and memory fragmentation.
When an inference worker crashes with torch.cuda.OutOfMemoryError, default system diagnostics such as nvidia-smi report near-100% memory utilization but reveal nothing about internal allocator state. Diagnosing whether an out-of-memory (OOM) failure stems from genuine capacity exhaustion, allocator fragmentation, unexpected activation scaling, or persistent memory leaks requires understanding the CUDA caching allocator and leveraging PyTorch memory snapshots.
The VRAM Budget in Production LLM Serving
Total VRAM on an inference accelerator is divided into five distinct components:
- Static Model Weights: The parameter footprint determined by parameter count and precision. For an unquantized 70B parameter model in FP16/BF16, weights consume approximately 140 GB across the tensor-parallel cluster (17.5 GB per GPU on an 8-GPU node). Under 4-bit quantization (such as AWQ or GPTQ), this drops to roughly 35 GB total.
- KV Cache Block Pool: Serving engines like vLLM and SGLang allocate the majority of remaining VRAM into discrete, paged physical blocks (typically 16 or 32 tokens per block) to eliminate internal fragmentation caused by variable-length generation requests. This is governed by engine parameters like
gpu_memory_utilization. - Transient Activations and Scratch Buffers: Intermediate tensor activations generated during forward passes. In decode passes (batch size B, sequence length 1), activation memory is small. In prefill passes (processing hundreds or thousands of prompt tokens simultaneously), activation memory scales with sequence length and batch size. Additional scratchpad memory is claimed by kernels such as cuBLAS, cuDNN, and FlashAttention workspaces.
- Engine and Runtime Overhead: CUDA context overhead (typically 300 MB to 1 GB per GPU), NCCL communication buffers for distributed tensor parallelism, and CUDA graph execution pools.
- Fragmented and Unallocated Reserved Memory: Memory requested by PyTorch from the CUDA driver via
cudaMallocthat remains allocated to the PyTorch memory pool but is currently unassigned to active tensors.

CUDA Caching Allocator Internals
Invoking the CUDA driver API cudaMalloc and cudaFree directly during inference is computationally prohibitive because both calls introduce device-wide synchronization barriers that stall GPU streaming multiprocessors (SMs). To avoid this penalty, PyTorch implements a caching allocator.
The caching allocator operates hierarchically:
- Segments: The allocator requests coarse memory chunks from the CUDA driver (typically 2 MB to 20 MB or larger) using
cudaMalloc. These are known as memory segments. - Blocks: When Python code allocates a tensor (such as an intermediate layer activation), the allocator carves out a sub-block within an existing segment.
- Splitting and Merging: When a tensor is deleted in Python, its block is marked as free within PyTorch's internal free list rather than being returned to the operating system or CUDA driver. Contiguous free blocks are merged back together to satisfy larger future requests.
This design introduces the critical distinction between allocated memory and reserved memory:
- Allocated Memory: The exact byte count actively referenced by live
torch.Tensorobjects. - Reserved Memory: The total byte count acquired by PyTorch from the CUDA driver via
cudaMalloc. - Free Device Memory: Total physical VRAM minus Reserved Memory and driver overhead.
Internal vs. External Memory Fragmentation
Memory fragmentation occurs when the allocator possesses sufficient total free space across its reserved segments to satisfy an allocation request, but cannot satisfy it because the free memory is split into non-contiguous slices.
- External Fragmentation: Multiple small active tensors sit interspersed among free blocks, preventing the allocator from carving out a contiguous 512 MB block even if 4 GB of total free memory is scattered across the segment.
- Reserved-but-Unallocated Gap: When
torch.cuda.memory_reserved()is significantly higher thantorch.cuda.memory_allocated(), high fragmentation is preventing block reuse, forcing the allocator to issue freshcudaMalloccalls until the GPU runs out of physical memory.
Virtual Memory Management and Expandable Segments
Historically, external fragmentation was mitigated by tuning split-size thresholds via environment variables like PYTORCH_CUDA_ALLOC_CONF=max_split_size_mb:512. However, this was a blunt heuristic that often increased allocator overhead.
In modern PyTorch releases, virtual memory management addresses fragmentation at the virtual address level. By setting:
export PYTORCH_CUDA_ALLOC_CONF=expandable_segments:TrueThe allocator leverages low-level CUDA Virtual Memory Management APIs (cuMemCreate, cuMemAddressReserve, cuMemMap, and cuMemSetAccess). Instead of requiring physically contiguous cudaMalloc segments, PyTorch reserves a large virtual address space and maps physical memory pages non-contiguously as needed. This allows dynamic segments to expand without moving existing tensors, virtually eliminating external fragmentation in variable-length inference workloads.
Capturing and Visualizing Memory Snapshots
When profiling memory behavior or debugging intermittent OOM crashes under high load, aggregate statistics from torch.cuda.memory_allocated() or torch.cuda.memory_summary() provide insufficient temporal resolution. They show point-in-time totals, not which specific tensor or operation caused the spike.
PyTorch includes a built-in memory history recorder (torch.cuda.memory._record_memory_history) that logs every allocation, free, and segment lifecycle event along with full Python stack traces.
Recording Snapshots in Python
The following script demonstrates capturing a full memory trace during an inference pass and saving the pickled snapshot:
import torch
import torch.cuda.memory as memory

def profile_model_execution(model, input_batch):
    # Enable memory history recording with stack traces
    # Setting max_entries bounds memory overhead of trace recording
    memory._record_memory_history(
        enabled="all",
        context="all",
        stacks="all",
        max_entries=100000,
    )

    try:
        with torch.no_grad():
            output = model(input_batch)
            torch.cuda.synchronize()
    except torch.cuda.OutOfMemoryError as e:
        print("Caught OutOfMemoryError. Dumping post-mortem snapshot...")
        memory._dump_snapshot("oom_snapshot.pickle")
        raise e
    finally:
        # Save trace for successful execution analysis
        memory._dump_snapshot("inference_snapshot.pickle")
        # Disable recording to avoid performance overhead in production
        memory._record_memory_history(enabled=None)

    return output
Analyzing Snapshots with the PyTorch Memory Visualizer
The generated snapshot file (inference_snapshot.pickle or oom_snapshot.pickle) can be opened directly in any modern browser using the interactive visualizer hosted at https://pytorch.org/memory_viz.
The visualizer provides three critical diagnostic views:
- Active Memory Timeline: A temporal graph showing allocated vs. reserved memory across time. Spikes correspond to specific operations (such as multi-head attention projections, logit generation, or KV cache allocation). Clicking any point on the graph reveals the exact Python filename, function, and line number that triggered the allocation.
- Allocator State and Segment Map: A block diagram displaying every physical segment managed by the allocator. Free blocks appear in gray, while active tensors appear color-coded by stack frame. If the segment map shows dozens of tiny, isolated allocations preventing segment consolidation, external fragmentation is the root cause.
- Out-of-Memory Trace: When an OOM occurs, the visualizer highlights the failed allocation request, the requested byte size, the largest contiguous free block available, and the stack frame attempting the allocation.
Common VRAM Leak Patterns in LLM Services
Production LLM inference servers frequently experience slow VRAM creep over days of continuous operation. The most common structural root causes include:
1. Unbounded Tokenizer Output or Logit Accumulation
Storing raw un-detached output tensors or cumulative conversation embeddings across multi-turn sessions prevents Python garbage collection. Even if tensors are moved to CPU, intermediate computation graphs may remain anchored if gradients were unintentionally enabled (torch.is_grad_enabled() == True). Always wrap inference execution in torch.inference_mode() (which is more aggressive than torch.no_grad() as it disables view tracking and version counters).
2. CUDA Stream Buffer Accumulation
When dispatching operations across custom CUDA streams, tensors freed on one stream may remain classified as active_awaiting_free by the allocator until stream synchronization occurs. Without periodic synchronization or proper stream dependencies, the allocator cannot recycle the underlying blocks.
3. Aggressive KV Cache Utilization Settings
In frameworks like vLLM, gpu_memory_utilization defaults to 0.90 (allocating 90% of available GPU memory to weights, KV cache, and runtime overhead). If an engineer raises this setting to 0.98 to maximize KV cache token capacity, unexpected prefill activations on long prompts (e.g., 32,000 tokens) will exceed the remaining 2% headroom, triggering an unrecoverable OOM.
The safe production practice is to calculate peak activation memory during maximum-context prefill batches, profile with torch.cuda.max_memory_allocated(), and size gpu_memory_utilization such that peak activation headroom remains at least 10% to 15% above static requirements.
Production Optimization Checklist
To ensure robust GPU memory utilization in production LLM deployments:
- Enable virtual memory segment expansion: Set
PYTORCH_CUDA_ALLOC_CONF=expandable_segments:Truein your container environment to eliminate external fragmentation. - Enforce strict inference mode: Ensure all forward paths execute inside
with torch.inference_mode():blocks. - Profile prefill vs. decode memory: Measure maximum prefill sequence activation requirements separately from steady-state decode steps.
- Configure automated OOM dumping: Register post-mortem snapshot dumps in error-handling middleware so intermittent production failures capture actionable trace files without requiring manual reproduction.
- Monitor allocator health: Track both
torch.cuda.memory_allocated()andtorch.cuda.memory_reserved()metrics in Prometheus/OpenTelemetry to identify widening reservation gaps before workers crash.
Sources
- PyTorch CUDA Memory Management Documentation: https://docs.pytorch.org/docs/stable/torch_cuda_memory.html
- PyTorch Engineering: Visualizing All Allocations over Time: https://pytorch.org/blog/understanding-gpu-memory-1
- PyTorch Memory Visualizer Tool: https://pytorch.org/memory_viz
- NVIDIA CUDA Driver API: Virtual Memory Management: https://docs.nvidia.com/cuda/cuda-driver-api/groupCUDAVA.html
- vLLM: Efficient Memory Management for Large Language Model Serving with PagedAttention: https://arxiv.org/abs/2309.06180
- FlashAttention: Fast and Memory-Efficient Exact Attention with IO-Awareness: https://arxiv.org/abs/2205.14135
- PyTorch Configuration Environment Variables: https://docs.pytorch.org/docs/stable/notes/cuda.html#optimizing-memory-usage-with-pytorch-cuda-alloc-conf